
In finance, Volume-Weighted Average Price (VWAP) is a ratio of the profit traded to complete volume traded over a distinct time horizon – normally one day. It’s a portion of the average price a stock traded at over the trading horizon.

Definition Open Interest is the total number of options or futures contracts that are “open”, meaning currently owned by an investor and not yet expired. Details Think first in terms of options contracts: by owning an option, it signifies that there is interest in actually trading that stock, although at a different price. Since this Read More…
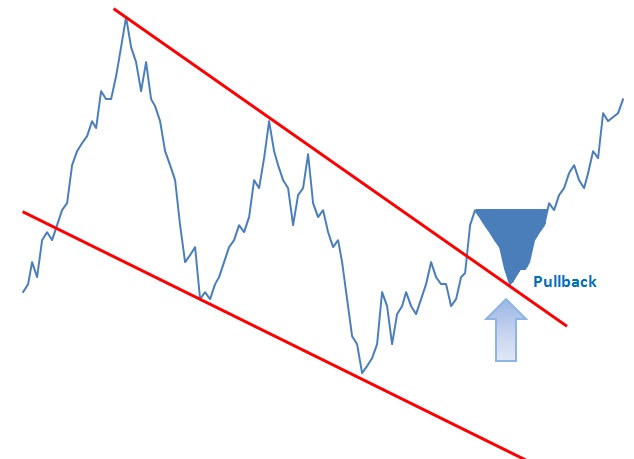
A pullback is a technical analysis term used frequently when a stock “pulls” back to a resistance and/or support line, usually after a breakout has occurred. Pullbacks can be in an uptrend or downtrend and can pull back upwards or downwards. In the example below we can see a pullback as it retraces back to Read More…
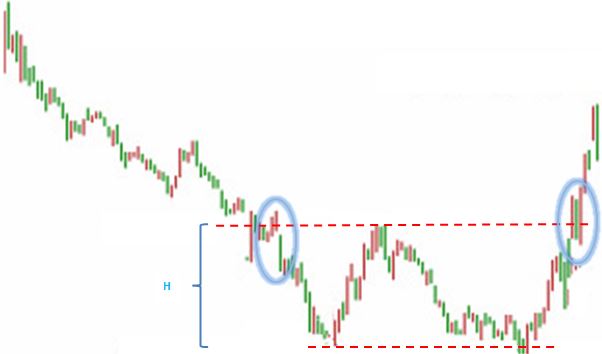
Double Bottoms are reversal patterns and often seem to be one of the most common (together with double top patterns) patterns for currency trading. Double Bottoms patterns are identified by two consecutive low prices of the same depth with a moderate pull back up in between (neckline peak).

Definition When you are looking at a sequence of related numbers (for example, the price of a single stock over time, the height of all students in a classroom, or how many breakfasts you will get out of a box of a particular cereal), the “variance” is how far away the numbers get from the Read More…
ETFs are collections of assets into bundles you can invest in all at once, the most popular ones follow indecies (such as SPY following the S&P 500), which is one way for an investor to build a diverse portfolio without holding dozens of individual positions. However, using financial derivatives and debt, there are also “Leveraged Read More…
The S&P 500, or the Standard & Poor’s 500, is a stock market index based on the common stock prices of 500 top publicly traded American companies, as determined by S&P. It differs from other stock market indices like the Dow Jones Industrial Average and the Nasdaq Composite because it tracks a different number of stocks and weights the stocks differently. It is one of the most commonly followed indices and many consider it the best representation of the market and a bellwether for the U.S. economy.

Good Till Date Order Terms If you have ever placed a limit or stop order, you have see the “Good Till Day” order term on the trading menu: A “Good-Till-Day” order is simply one that will cancel at the end of the trading day if it does not fill. So, for example, if you have Read More…
How Do I Build a Diversified Portfolio? Understanding what it means to build a diversified portfolio is one of the first concepts a new investor needs to understand. When talking about stocks, diversification means to make sure you don’t “put all of your eggs in one basket.” What Does It Mean To Diversify? Simply put, Read More…
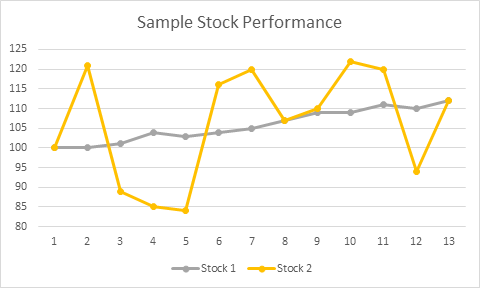
Sharpe Ratio for Beginners Introduction The Sharpe Ratio is an important tool for evaluating a stock, or a portfolio, based on how risky it is to get a higher return. You can use the Sharpe Ratio to determine how consistent the returns of a stock or portfolio are, so you can determine if the returns Read More…

The head-and-shoulders pattern is one of the most popular chart patterns in technical analysis. The pattern looks like a head (the middle peak) with two shoulders (two equal heiight peaks).

The Moving Average Convergence-Divergence (MACD) indicator is one of the easiest and most efficient momentum indicators you can get. It was developed by Gerald Appel in the late seventies. The MACD moves two trend following indicators and moving averages into a momentum oscillator by subtracting the longer moving average from the shorter moving average. The Read More…

Fixed income analysis is the process of evaluating and analyzing fixed income securities for investment purposes. Fixed Income represents a distinct asset class. Investors and analysts perform fixed-income analysis to Evaluate the risk characteristics underlying debt securities and to assess the capacity of the borrowing entity to meet its financial obligations (credit analysis) Identify which Read More…
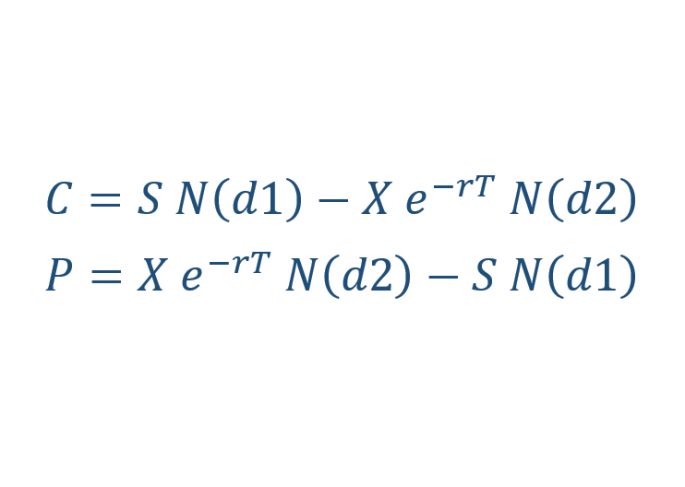
Introduction The Black-Scholes formula is the most popular ways to calculate the true price of an option. It is easy to calculate the intrinsic value, but the extrinsic value can be very tricky to calculate. Black Scholes is used for calculating two types of options. Options on stocks Stock Options. Fisher Black, Robert Merton and Read More…

Definition: The simultaneous purchase of a security on one stock market and the sale of the same security on another stock market at prices which yield a profit. In Depth Description: In economics and finance, arbitrage is the practice of taking advantage of a price difference between two or more markets: striking a combination of Read More…

Over-The-Counter (OTC) Stocks Most investors are familiar with NASDAQ, the NYSE (New York Stock Exchange), TSX (Toronto Stock Exchange), and most other large national stock exchanges. However, there are also thousands of companies that want to sell shares to the general public, but are not able to sell on these exchanges. Stock traded on these Read More…
Home Budget Calculator! The most difficult thing people think of with personal finance is building your monthly budget, and sticking to it. There are tons of different expenses and payments to consider, so we put all the big ones in one place! This tool will also help you see exactly how much you can set Read More…
Car Loan Calculator! The first BIG purchase many people make is when they buy their first car. This calculator will help show the impact of many of the biggest factors people need to consider when taking out their first loan for a big purchase. If you have used our Credit Card Payment Calculator to see Read More…
Credit Card Minimum Payments Calculator! Credit Cards! These are usually the first “loans” a person takes out, and the first monthly payments! Tens of thousands of young people dig themselves deep into credit card debt before they even realize it, so have fun with this payments calculator to see how much these bits of plastic Read More…
Compound Interest Calculator The first thing to consider with all personal finance is the idea of compound interest! This is what separates the “Piggy Bank” savers from the Warren Buffets; making use of interest compounding is how you can really make your savings grow! If you have already used our Investment Return Calculator, you can Read More…
Advanced Investment Return Calculator Find out the difference between Simple and Compound Interest! See how big an impact your tax rates and inflation have on your savings over time! If you have already used our Becoming A Millionaire Calculator, you can use your targeted Expected Investment Return numbers in this calculator to see how to Read More…
How to Become a Millionaire Calculator Want to be a millionaire? Everyone does, but do you know how much you need to save and what rate of return you need to get on your investments to reach that million level? This financial calculator helps you learn how your savings grows over time and how Read More…
Buy Vs Lease Calculator! The biggest expense most people have is the place they live, one of the biggest decisions young people face is whether to buy their home, or continue to rent. Conventional wisdom says that buying will pay off in the long term, but believe it or not this is not always the Read More…
Use this calculator to find Net Present Value, based off expected annual growth, cash flow over a variable number of years, and separations of cash flow between investments and operations. This calculator will help you determine the attractiveness of a company by seeing how much it would be worth if you wanted to buy it Read More…
Use this calculator to calculate an Internal Rate of Return! Inputs include regular deposits and withdrawals, up to 20 irregular withdrawals, and whether to calculate based on deposits at the beginning or end of the period. The Internal Rate of Return or “IRR” is an important concept in math, finance and economics. It is frequently Read More…

Technical analysis software automates the charting, analysis and reporting functions that support technical analysts in their review and prediction of financial markets (e.g. the stock market).

Serbia is a European country with an upper-middle income economy. It had one of the fastest growing economies of its region, in terms of GDP growth rates prior to the global recession, and attracted solid foreign direct investment. This article explores Serbia’s economic strengths along with the stock market, largest banks and ways one can invest in the country.

A cup-and-handle chart pattern resembles a cup of tea. These are bullish continuation patterns where the growth has paused. momentarily, it trades down and then continues its upward pattern. This pattern must always be at least 5 weeks long and can last up to a year.

Latvia is an EU member country that experienced superior GDP growth rates prior to the financial crisis in 2008. It underwent significant privatization, which resulted in large foreign direct investment inflows. Its economy was ranked first among developing countries until 2008.

Fractions What is a fraction? A “Fraction” means one piece of a whole. You can use fractions in any case where it might be useful to look at something in parts, rather than the whole thing at once. The most delicious fractions are slices of pizza. If the pizza is in 8 slices, we know Read More…

Belgium is an EU member located in Western Europe. It has a strong industrialized economy, well-developed transportation infrastructure, and a highly productive work-force making it an attractive destination for foreign capital.

Italy is an EU member country and one of G-8 leading industrialized economies, having the seventh largest economy in the world. Its thriving small and medium enterprises play an important economic role.

Ireland is an EU member country with a knowledge-based economy and strong industries in services and technology. With attractive corporate tax rates, Ireland has been ideal destination for multinational corporations.

Hungary is an EU member country with a medium-sized, liberal economy that is rapidly developing. It has the 5th largest economy in Central and Eastern Europe, with major exports in machinery, chemicals, textiles, and agricultural products. Hungary’s Main Industries Hungary is economically known for its strength in: Agriculture Sector Wheat Corn Sunflower Potato Sugar Read More…

Peru is a Latin American country with an emerging, market-oriented economy that has been among the top performers in South America. Rich in natural resources, it is a major exporter of gold, copper, zinc, and fish.

Portugal is an EU member country with a high-income and service-based economy. It enjoys vast forests, has a strong industrial base, and is an important agricultural exporter.

Romania is an EU member country, which has experienced positive foreign direct investment and GDP growth following privatisation initiatives over the last decade. It has an upper-middle income economy strong in its industrial and agricultural sectors.

Argentina is a South American country that is one of the G-20 economies. It is the third largest economy in Latin America and has the highest GDP per capita in its region. It possesses plenty of natural resources, a strong agricultural sector, and a well-educated population.

Albania is one of south eastern European countries that have shown promising economic growth potential. It has been increasingly attracting foreign direct investment and possesses a strong agriculture and natural resources industry

Gross National Product is the value of all goods and services produced by a country’s residents.

Free Cash flow is the cash available to all the capital providers of a company. There are two types of free cash flows: 1) Cash flow available to pay out to all capital providers and 2) Free Cash Flow to Equity (FCFE).

The Form-8K is a SEC-mandated report filed by public companies to report unexpected events or transactions that are material in nature, and thus have an impact on the share prices of the company.
Fixed income analysis is the process of evaluating and analyzing fixed income securities for investment purposes.

In investment valuation, financial modeling refers to the procedure and methodology performed to determine the value of an asset or financial security. Fundamentally, a business or company’s current value can be viewed as being derived from its future cash flow streams. An investor deciding whether to purchase or sell a stock, therefore, will be interested in estimating such value.

The earnings reports released by companies can be invaluable in providing such information. Released by public companies on a quarterly and annual basis, they can be used to assess and gauge a company’s: financial condition, strategic plans, industry and competitive position, Key performance drivers and risk factors and Future performance.

Discounted Cash Flow is a valuation technique or model that discounts the future cash flows of a business, entity, or asset for the purposes of determining its value. One aspect of investment decision-making entails discovering the fair value of investments.

The Debt-Snowball Method is a debt-management strategy aimed at reducing a borrower’s obligations. Borrowers can use this method to slowly eliminate their debt by focusing on their smallest debt balance, followed by larger ones until all obligations are paid off.

Covariance is a statistical measure of the extent that 2 variables move in tandem relative to their respective mean (or average) values. In the investment world, it is important to be able to measure how different financial variables interact together.

The use of correlation analysis extends to numerous important fields. For example, in finance, correlation analysis can be used to measure the degree of linear relationships between interest rates and stock returns, money supply and inflation, stock and bond returns, and exchange rates.

Comprehensive insurance to a form of insurance policy which includes a broad range of coverage or protection.

The options collar strategy is designed to limit the downside risk of a held underlying security. It can be performed by holding a long position in a security, while simultaneously going long a Put and shorting a Call.

The CME Group is an order-driven exchange that facilitates the trading of forward, futures, and options contracts on numerous products within key asset classes such as agriculture, energy, metals, equities, interest rates, and exchange rates.
The CBOT is an exchange providing trading in derivatives contracts and clearinghouse functions. It allows traders to buy and sell contracts on several products in asset classes such as agriculture, energy, metals, equities, bonds, and exchange rates. The majority of its trades are conducted electronically.
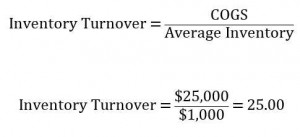
Measuring the cash conversion cycle is important to liquidity, working capital, and the operating cycle of a company. Good management of the CCC can also enhance a company’s cash flows, allowing it to effectively make sound investing and financing decision. Managing the CCC entails efficient inventory, receivables, and payables functions, and should be part of a company’s overall operational strategy.
Capital funding is the provision of monetary resources or capital for productive uses. Capital provided by investors or other parties is used by various entities such as governments, companies, organizations, and individuals in order to fund their functions and operations. In most cases, capital provided is compensated by some form of return to the provider. Two important types of capital are equity and debt. Equity capital represents an ownership stake, while debt capital is a form of lending.

Account Receivables Management refers to the set of policies, procedures, and practices employed by a company with respect to managing sales offered on credit.

Account Payables Management refers to the set of policies, procedures, and practices employed by a company with respect to managing its trade credit purchases.

Insurance is protection from losing or damaging something. It is defined as the transfer of loss risk in exchange for payment. Basically, if we damage or lose something that was insured, the insurance will cover the cost of having it fixed or replaced.
A Commercial Bank is a type of financial institution that is responsible for catering to everyday banking needs. Commercial Banking is also sometimes referred to as Retail Banking. This is the kind of bank that individuals go to for their everyday financial needs.

We will teach you how to save money so that you can afford your future now. There are two main questions you need to ask yourself to effective save money: A.“How much will I need?”, and B.“What can I afford?”
There are a couple of different strategies that you can employ to build a stock portfolio: 1) You can take the risk that the products will not be good, and buy the cheapest brands of everything on the list; 2) You can buy half the things on the list from the discount aisle, while splurging on good brand names for the other half; or 3) You can avoid the risk of disappointment and buy just big brand names.
A portfolio is a collection of assets that contribute collectively to an overall return. There are many different reasons you could create a portfolio, and you need to define your reason or objective from the very beginning before adding stocks and other securities to your account.

Price ceiling is a government-mandated limit on the price that can be charged for a given product, such as a utility or electricity. The intended purpose of a price ceiling is to protect the consumers from conditions that would make a vital product from being financially unattainable for consumers.

A “Poison Pill” creates a strong defense mechanism for a “targeted takeover company” allowing the company to properly identify legitimate and beneficial acquisitions and weed out the actions of corporate raiders. The “Poison Pill” is also useful in slowing down the speed of potential raids.

A straddle is an investment strategy that involves the purchase or sale of an option allowing the investor to profit regardless of the direction of movement of the underlying asset, usually a stock.

An oligopoly is characterized by a small number of sellers who dominate an entire market.
Monopoly, in economic terms, is used to refer to a specific company or individual has a large enough control of a particular product or service that allows them to influence it’s price or certain characteristics.

Monopolistic Competition is characterized as a form of imperfect competition.

Money supply is the total amount of money available in an economy at any particular point in time.

Monetary Policy refers to the process by which the Monetary Authority of a given country implements a variety of measures to control the supply of money.

Modern Portfolio Theory (MPT) is an investment theory whose purpose is to maximize a portfolio’s expected return by altering and selecting the proportions of the various assets in the portfolio.

Fiscal policy is the use of government spending to influence the economy.

The Expected Return is a weighted-average outcome used by portfolio managers and investors to calculate the value of an individual stock, or an entire stock portfolio.

A good way to evaluate a manager is to ask many relevant questions pertaining to your own personal financial situation and your financial goals. Examples of questions to ask are:

Elasticity is one of the most important terms in economics, and has a plethora of uses. Economists define elasticity as the ratio of the percent change in one variable to the percent change in another valuable.

If you own a bond or manage a bond portfolio, chances are that will you be following daily interest rates. You know that bond prices increase when rates rise, and decrease when rates fall. But how do you measure the bond’s price sensitivity to such rate fluctuations? The answer is duration.

Dupont Analysis breaks the Return on Equity into several different components in order to analyze where the returns are coming from.
Direxion Small Cap Bear3X – Triple-Leveraged ETF is an index fund ETF (Exchange Traded Fund) designed to seek a daily result of 300% of the INVERSE of the performance of the Russell 2000 Small Cap Index.

Straight line depreciation is the most commonly used and simplest form of depreciation.

Depreciation refers to the gradual and permanent decrease in value of the assets of a firm, nation or individual over its lifetime.

A consumer price index (CPI) is the relative measure of a market basket of consumer goods and services purchased by households.
A basic material used in manufacturing or commerce that is interchangeable with other the same commodities coming from a different source. The quality of a specific commodity may differ slightly, but it is essentially uniform across producers. When they are traded on an exchange, commodities must also meet specified minimum standards, also known as a basis grade. Typical types of commodities are corn, gold, silver, steel, etc.

For a candlestick chart, the body or real body is the wide or colored part of a candle that represents the range between the opening and the closing prices over a specific time period (minute, hour, day, week or other). They are the most basic building block for candlestick charts.
A point on a candle stick chart representing a specific time period (a day, an hour, a minute, etc) in which the underlying stock price has moved. Candlesticks will have a body and usually two wicks – one on each end. For a white (could also be green) candlestick, the bottom of the body represents the opening price and the top of the body represents the closing price. For red candlesticks, it is just the other way around. The top and bottom tips of each wick are the day’s highest and lowest price respectively.
A small line (like a candle wick) found at the top or bottom of an individual candle in a candlestick chart.

An investment strategy that aims to capitalize on the continuance of existing trends in the market. The momentum investor believes that large increases in the price of a security will be followed by additional gains and vice versa for declining values.
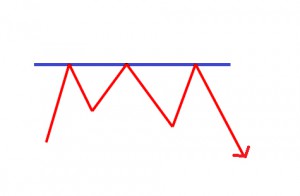
A point or range in a chart that caps an increase in the price of a stock or index over a period of time. An area of resistance, resistance line or resistance level indicates that the stock or index is finding it difficult to break through it, and may head lower shortly. The more times that the stock or index tries unsuccessfully to break through the resistance line, the stronger that area of price resistance becomes.

The price-to-sales ratio (Price/Sales or P/S) provides a simple approach: take the company’s market capitalization (the number of shares multiplied by the share price) and divide it by the company’s total sales over the past 12 months. The lower the ratio, the more attractive the investment.

High inflation and high unemployment occurring simultaneously.

A security with a guarantee of a return rate that is higher than the rate of inflation if it is held to maturity

The fee charged by a broker or investment advisor in exchange for investment advice and/or handling the purchase or sale of a security. Commissions vary from brokerage to brokerage.

When an investor takes an account with a licensed brokerage firm that allows the investor to deposit money and place investment orders through the brokerage firm. There are several different types of brokerage accounts. Full-service brokers provide investment advice and charges high fees for their services. Most online brokers provide less services at a far Read More…

Earnings estimates provide one strong measure of potential future performance and are a mainstay of stock investing research.

Return on Equity (ROE) is used to measure how much profit a company is able to generate from the money invested by shareholders.

Price to Earnings is the most usual way to compare the relative value of stocks based on earnings since you calculate it by taking the current price of the stock and divide it by the Earnings Per Share (EPS).
The question of when to sell stocks is not easily answered. On the one hand, you know a correction is coming but the question of “when” isn’t so clear. Anyone who has ever sold early only to stand by and watch others reap in huge profits have felt the pain of premature sales.
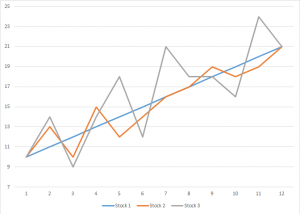
Stock volatility information can be used in many different ways but here is a quick and easy bit of stock volatility information that you can begin using today.
It is impossible to predict what the market will do today, tomorrow or next year, but there is one thing that is definite: markets go up, they go down, and they stay the same.
The golden rule of stock investing dictates cutting your losses when they fall 10 percent from the price paid, but common wisdom just might be wrong. Instead, use some common sense to determine if it’s time to hold or fold.
A hedge fund is one of the investment tools you will aspire toward as a serious investor. The first hedge fund came out in 1949 as a strategy to neutralize the effect of overall market movements on a portfolio.