Buying what you know takes advantage of your familiarity with a product or market and translates that knowledge into potential earnings. Think of it this way; good investors understand opportunity and risk.

Small cap stock investing is volatile. That is one of first things you should know and understand. So, why risk your money by investing in what is typically considered risky business?

Hyperinflation refers to out of control or extremely rapid inflation, where prices increase so quickly that the concept of real inflation becomes meaningless.

Inflation refers to the general rising of prices for goods and services in the economy, due to an increase in the amount of money and/or credit available.

A CD or Certificate of Deposit is one of the safest and liquid forms of investment available. Insured by the FDIC (Federal Deposit Insurance Corporation), CDs are a type of interest earning deposit account.

In a cap-weighted index, large price moves in the largest components (companies) can have a dramatic effect on the value of the index.

Market risk is a measure of how much of a loss an investor is facing while trading.
Your ideal investment or investment portfolio gives you the most opportunity for the risk you can bear. In this sense, it is important to understand the risk inherent in an investment before you look for the opportunity.
Diversification to reduce risk should seem obvious to most investors but a surprising number of people follow their instinct rather than intellect when it comes to investing.

The buy and hold strategy is essentially just what it sounds like: Purchase stocks and then hold them for an extended period of time. The underlying assumption for the buy and hold strategy is that stocks tend to go up in price over extended periods of time.
Learn the classic market cycles of accumulation, mark up, distribution and mark down so that you can time the market -consistently – and make steady profits any time.

Everywhere you turn there is another proprietary stock market timing system being sold. Let’s take a few minutes to review these claims against common sense.

It is only an offer and will not be accepted if the seller is not willing to let go at the offer price. This offer price pertains to all traded investments.

The difference between the ask price and the sell price is called the “spread” and it is kept by the broker.
If you are brand new to investing then take time to understand what you are reading when viewing a Stock Exchange Symbol and learn Stock Market Investing Basics.

Many people start trading stocks and never learn about stock trading risk management. The one’s that do learn, usually learn after they have been trading for a while, not before they start trading.

A REIT or Real Estate Investment Trust may be the perfect investment vehicle. REITs own, and often operate, real estate but are publicly traded like stock.

The U.S. Dollar has lost more than 30 percent of its value relative to other world currencies. Shorting the U.S. dollar and buying other world currencies is one way to make money from this trend.
By measuring the compilation of similar stocks instead of just one or two stocks, a stock index provides information about that particular market or segment.
A non-bank organization that regularly trades large blocks of stocks.

A series of technical indicators used by traders to predict the direction of the major financial indexes.

A national government that owes money to international financial institutions such as the World Bank, foreign governments, or to foreign lenders.

Many stock analysts have identified market trends related to specific times of the year. The success ratios of these trends are often far stronger than most other indicators.

A technical analysis indicator that compares advancing and declining stock issues and trading volume as an indicator of overall market sentiment. The Arms Index, or TRIN (Traders Index), is used as a predictor of future price movements in the market primarily on an intraday basis.

A market indicator used to determine volatility levels in the market without factoring in price direction. It is calculated by taking the absolute value of the difference between the number of advancing issues and the number of declining issues. Typically, large numbers suggest volatility is increasing, which is likely to cause significant changes in stock prices in the coming weeks.
A technical analysis tool that represents the total difference between the number of advancing and declining security prices. This index is considered one of the best indicators of market movements as a whole. Stock indexes such as the Dow Jones Industrial Average only tell us the strength of 30 stocks, whereas the advance/decline index can provide much more insight into the movements of the market.

By aggregating the value of a related group of stocks or other investment vehicles together and expressing their total values against a base value from a specific date. Market indexes help to represent an entire stock market and thus give investors a way to monitor the market’s changes over time.

Simplest, oldest, and most common form of business ownership in which only one individual acquires all the benefits and risks of running an enterprise. In a sole-proprietorship there is no legal distinction between the assets and liabilities of a business and those of its owner. It is by far the most popular business structure for startups because of its ease of formation, least record keeping, minimal regulatory controls, and avoidance of double taxation.

Definition The minimum amount of equity that must be maintained in a margin account. In the context of the NYSE and FINRA, after an investor has bought securities on margin, the minimum required level of margin is 25% of the total market value of the securities in the margin account. Keep in mind that this Read More…
Margin calls happen when your account value drops to a value below that allowed by a broker.

An entity that abides by specific legal requirements that sets it apart as having a legal existence, as an entity separate and distinct from its stockholders (owners).

Retained earnings is calculated by adding net income to (or subtracting any net losses from) the beginning retained earnings and then subtracting the dividends that were paid to shareholders

A plan offered by a corporation that allows investors to reinvest their cash dividends by purchasing additional shares or fractional shares on the dividend payment date.

Chart analysis is the same as Technical Analysis. It is mostly concerned with price and volume.
The Fed is the US central-banking system which is made up of 12 regional central banks

State regulations governing the sale of securities and mutual funds
Definition: An investment service that allows individuals to purchase a stock directly from a company or through a transfer agent. Not all companies offer DSPPs and the plans often have restrictions on when an individual can purchase shares. Example: The greatest benefit of using direct stock purchase plans for investors is the ability to avoid commissions by not Read More…
Since the bottom fell out of the stock market in 2008, investors have been shifting money from stocks into bond funds. Since 2007, there have been $1.39 trillion invested in Bond Funds versus $193 billion in stock funds. The most logical explanation is an attempt to find income and safety, but are bonds truly safe?

In the world of stock analysis, fundamental and technical analysis are on completely opposite sides of the spectrum. Earnings, expenses, assets and liabilities are all important characteristics to fundamental analysts, whereas technical analysts could not care less about these numbers and only focus on price and volume.
A phrase used for a stock where the price has dropped significantly in a short period of time. A falling knife security can rebound, or it can lose all of its value where the shares become worthless.

The total amount that the federal government has borrowed including internal debt (borrowed from national creditors) and external debt (borrowed from foreign creditors).
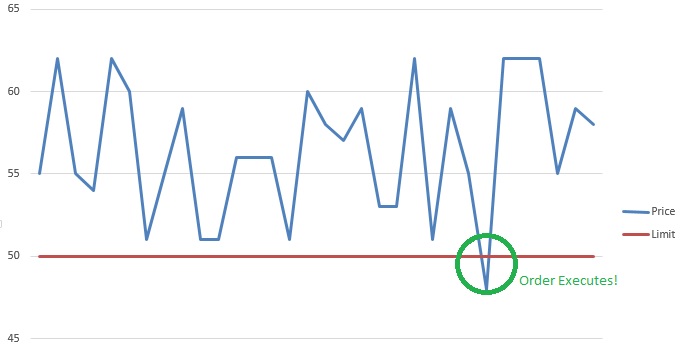
A Stop Limit is an order that combines the features of stop order with the features of a limit order. A stop limit order executes at a specified price (or better) after a specified stop price is reached. After the stop price is reached, the stop limit order becomes a limit order to buy (or sell) at the limit price or better.

The merger of companies at the same stage of production in the same or different industries.
US federal legislation of 1890 that prohibited the creation of monopolies by outlawing direct or indirect attempts to interfere with the free and competitive nature of the production and distribution of goods. Amended by the Clayton Act of 1914. Also called Sherman Act.

An order to buy or sell a stock at a fixed price. This order is active until 1) the trade is executed, 2) the investor decides to cancel it or 3) a specified time period elapses.

Stock prices are a direct result of supply and demand. All the other influences like debt, balance sheets, earnings and so on affect the desirability of owning (or selling) a stock.

Decreasing the long-run average and marginal costs that come from an increase in the size of a factory or plant.

A short call option position where the writer does not own the specified number of shares specified by the option nor has deposited cash equal to the exercise value of the call.

A high-risk bond with a low credit rating. Junk Bonds usually have a much higher yield than investment-grade bonds.

An alternative retirement plan to a 401(k) plan offered by non-profit organizations such as universities and charitable organizations, rather than corporations.

When a company offers to trade one security in return for another security.
Stock market prices are affected by business fundamentals, company and world events, human psychology, and much more.

You do not need anything else on a stock chart but the candles themselves to be a successful swing trader! And, there is nothing that can improve your trading more than learning the art of reading candlestick charts

Resistance and support levels are widely used by experienced traders to formulate trading strategies. For example, if a stock is approaching a very strong resistance level, a trader may prefer to close the position rather than take the risk of a significant decline if the stock uptrend reverses.

Analysis of ADX is a method of evaluating trend and can help traders to choose the strongest trends and also how to let profits run when the trend is strong.
If you perform four or more day trades in a 5 day period you may get flagged by the SEC as a “Pattern Day Trader.” This can cause you to lose your margin account status until you deposit enough cash to have $25,000 or more in your account. Many beginning traders have been bitten by this rule!

An inverted dead-cat bounce is quite the opposite of the dead-cat bounce. A quick look is if a trader owns a stock following a quick and large (5-20%) gain there is normally a gap up. If you sell on the next day after the gap up day, thus unlocking profits its because prices normally start falling before beginning a new move upward (Bulkowski, 2005).

A trading term called a dead cat bounce is used to when a stock is in a severe decline and has a sharp bounce off the lows. It occurs due to the huge amount of short interest in the market. Once the supply and demand has become unbalanced, any type of bear market rally will create a massive short covering which will lead to a swift price move up. This bounce will be short lived and followed up by heavy selling which will break the prior price low.

A gap in a chart is basically an empty space between one trading period and the one prior to that trading period. They normally form on account of an important and material event that will affect security, like an earnings surprise or a merger agreement.
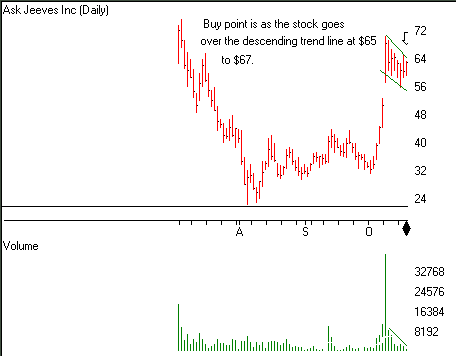
Flags and Pennants are categorized as a continuous pattern. They normally represent only brief pauses in a dynamic stock. They’re typically seen immediately after a quick move. The stock will then take off again in the same direction. Research shows that these patterns are many of the most reliable continuation patterns. Take a look at typical Flags and Pennant pattern.

The V top is a reverse V-shaped top thus the name. The top is quite sharp. It’s due to the irrationality of actors leading to a steep increase that will be corrected shortly afterwards. The V top will occur most often in an upward trend and will often signal a trend reversal. It can also appear in a downward trend, like when in an economic announcement.

The V bottom is shaped like a V thus the name. The dip will be quite sharp. It’s because the irrationality of actors leading to a steep fall which will be corrected shortly after. The V bottom will occur most often in a downward trend and will generally offer a signal trend reversal. It can also appear in an upward trend (like in an economic announcement).

A horizontal channel is a pattern that underlines investor’s indecisiveness. This horizontal channel is assembled by two horizontal and parallel lines that build the progress of the price. To confirm a line, there should be at least two points of contact with the price. The more contact points it will has, the more these will be durable and their breakout will give an substantial buy/sell signal.
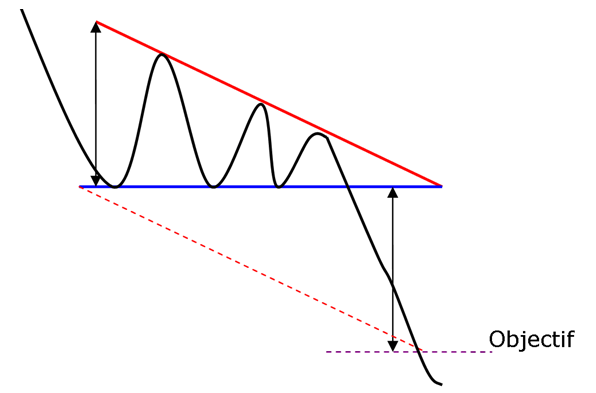
The descending triangle is a bearish continuation pattern. This pattern forms two converging lines. The initial is a downward slant which resistance and the other is a horizontal support. To validate the descending triangle, there must be oscillation between the two lines. The lines must be touched at least twice for validation.

The symmetrical triangle top is a bullish continuation pattern. This pattern forms two trend lines which are symmetrical to the horizontal and convergent. The initial pattern is a bearish slant that gives resistance and the other is a bullish slant that will be the support. To prove a symmetrical triangle top, one must have oscillation between the two lines. Each of these lines must be touched at least twice for validation.

A symmetrical triangle bottom is a bearish continuation pattern. This pattern forms two trend lines that are symmetrical to the horizontal and convergent. The initial one is a bearish slant that gives support and the other will be a bullish slant that will create a resistance. To prove a symmetrical triangle bottom there must have oscillation between the two lines. Each line has to touch at least twice for validation.

The ascending triangle is a bullish continuation pattern. This pattern is made by two converging lines. The first line is an upward slant which is the support and the other is a horizontal resistance line. To validate the ascending triangle, there has to be an oscillation between the two lines. Each line has to be Read More…
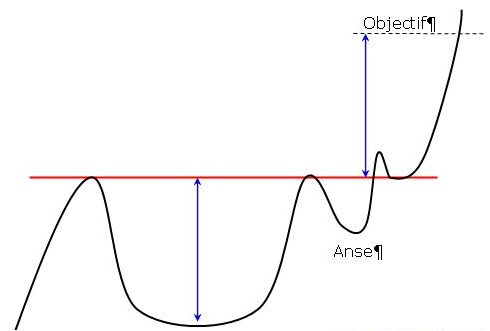
The cup with handle has a continuous pattern. This pattern is formed by two rounded bottoms, the first is deeper and wider than the second. The height of the cup and the handle will be aligned along a straight horizontal resistance. This is the neckline of the pattern.

The rounding top pattern is a reverse U-shape, also called a “reverse saucer. ” The top is rounded with a flat top. But as you’ll see in many cases there are several bullish peaks and they will not put in question the validity of the pattern.

The U-shaped bottom is a rounding bottom, also called a “saucer. ” The dip is rounded with a flat bottom. But we’ll see in many cases there are several bearish peaks, but they do not question the validity of that pattern.
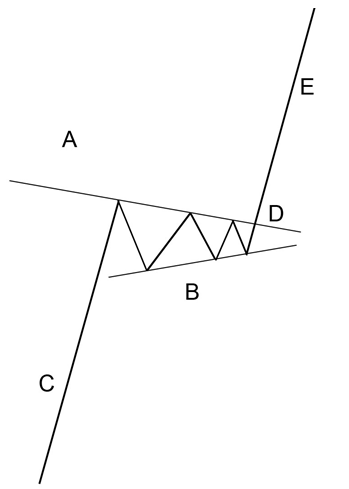
The pennant resembles the symmetrical triangle, but it’s characteristics are not the same. The pennants is shaped like a wedge of consolidation. Its normally appears after a sudden upward or downward movement. The life of a pennant is short according to the time frame used.

The descending flag shows as a continuation pattern. The flag is built by two straight downward parallel lines which is shaped like a rectangle. It is oriented in the direction of that trend which it consolidates. Contrary to a bearish channel, this pattern is quite short term and shows the fact that buyers will need a break.
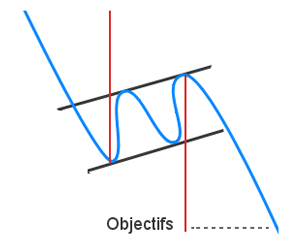
An ascending flag is a continuation pattern. The ascending flag is formed by two straight upward parallel lines which are shaped like a rectangle. It is adjusted in the direction of the trend that it consolidates. Contrary to a bullish channel, this pattern is quite short term and marks the fact the seller will need a break.

A bullish channel is called a continuation trend pattern. The bullish channel is assembled by two parallel lines that frame the upward price trend. A line is validated when there has been at least two points of contact with the price. The more contact points it has, the stronger the trend line is and the more their breakout will give a strong sell signal.
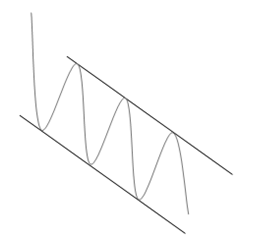
A bearish channel is a continuation trend pattern. The bearish channel is arranged by two parallel lines that frame the downward price trend. To certify a line, there has to be at least two points of contact with the price. The more contact points it has, the more the trend line is stronger and their breakout will give a stronger buy signal.

The triple top is a bearish pattern with an MN shape. Three bottoms will come in succession, reflecting an important resistance. This marks a reversal will.

Reverse head and shoulders is a trend reversal pattern. It will mark a desire to make a bullish reversal. The theory is the same as a triple bottom other than the second bottom will be lower than the others, which are technically at the same height. The reverse head and shoulders pattern will be formed by three bottoms that will succeed.
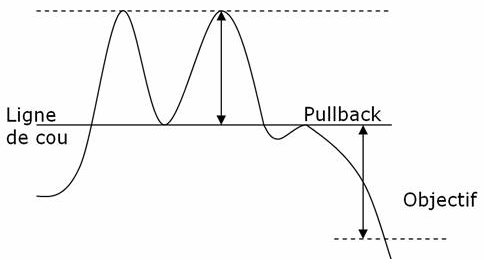
The double top is a bearish pattern shaped like an M. Two tops must succeed, imaging an important resistance. This marks a reversal. The pattern may also be in WV shape. We can consider a triple top as well.

A reversal pattern is called a diamond bottoms. This pattern is formulated by two juxtaposed symmetrical triangles. It is shaped like a diamond.

A falling wedge is a bullish reversal pattern made by two converging downward slants. To prove a falling wedge, there has to be oscillation between the two lines. Each of the lines must be touched at least twice for validation.

A bearish reversal pattern formed by two assembled upward slants is called a rising wedge. To validate rising wedge there must be oscillation between the two lines. These lines must be touched at least twice for validation.
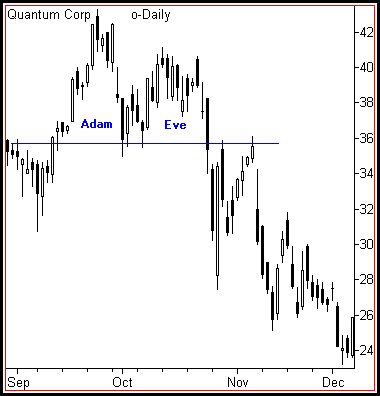
Stock charts print different topping formations. Some are classics, like the Descending Triangle, which can be understood and traded with little effort. However the emotional crowd additionally generates many undependable patterns while greed slowly evolves into mindless fear. Complex Rising Wedges will challenge a technician’s best effort at prediction while the unusual Diamond pattern burns trading capital swinging randomly back and forth.
The formation, ascending broadening wedge is called this because of its similarity to a rising wedge formation and then has a broadening price pattern.

The right-angled and ascending broadening chart pattern is not one you might choose to trade. Other chart patterns perform much better. Downward breakouts have a big break even failure rate which may disqualify them from your trading tools. Upward breakouts have only a middling average rise, and that is if you trade them perfectly.
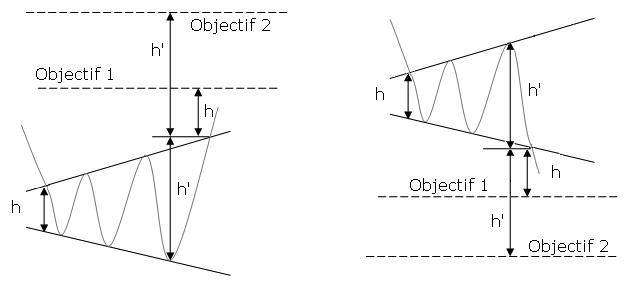
The broadening bottom is one of those chart patterns that appears often, but you might want to avoid trading. The performance rank approaches the bottom of the list with a comparatively high break even failure rank and low average rise in a bull market. Its only redeeming value is the partial decline which does an excellent job of predicting an upward breakout.

Charting Software is an analytical, computer-based tool used to help equity (stock) traders with trading analysis by charting the price stock price for various time periods along with various indicators. Equity charting software packages are used by many traders to determine the direction on any given stock price.
With ETFs, you can scaled down the size of the transaction for small investors.

Bear ETFs short stocks to achieve their goals. Bear ETFs show gains when the underlying stocks loose value. Bull ETFs use long positions and show gains when the underlying stocks show gains.
The DIA -DIAMONDS Trust, Series 1 ETF invest in a basket of Dow Jones Industrial Average stocks that will track the price and performance of the Dow Jones Industrial Average (DJIA) Index.

A trailing stop loss is calculated in a manner like the way we calculated our initial stop loss. The only difference being that while we calculated our stop loss from the entry price, we’re calculating our trailing stop loss from the highest price since entry.

Had the American Indians sold their beads and trinkets they received from selling Manhattan Island, invested their $16 and received 8% compounded annual interest, not only would they have enough money to buy back all of Manhattan, they would still have several hundred million dollars left over. That is the power of compound interest over time.

Expirations determine when your order gets placed on the market.
Order Types offered in our Stock Market Game: Market Orders, Limit Orders, Stop Market Orders, Stop Limit Orders and Trailing Stop Orders
Real-life and virtual trading hours for our site (all times Eastern).
Note: Stock Market trading is Monday-Friday, except on holidays.
Stock market prices are affected by business fundamentals, company and world events, human psychology, and much more
An investor’s instructions to a broker or brokerage firm to purchase or sell a security. Orders are typically placed over the phone or online. Orders fall into different available types which allow investors to place restrictions on their orders affecting the price and time at which the order can be executed.

Penny stocks are stocks with a share price of $5 or less.

Definition: The amount of sales generated for every dollar’s worth of assets. It is calculated by dividing sales in dollars by assets in dollars. Formula: Asset Turnover = Revenue / Assets Also known as the Asset to Turnover Ratio. More Detail: Asset turnover measures a firm’s efficiency at using its assets in generating sales or revenue – the Read More…
Day traders buy and sell the same stock (or other investment type) within a single trading day.
A list of the 25 most popular (largest) mutual funds.