Every year or two, most of us go to the doctor’s office to receive a check-up on the state of our physical health. The doctor typically checks several measurements (height, weight, blood pressure, etc.) in order to gauge how our health has progressed over the past year. They can then use their results to determine Read More…
The price-to-sales ratio (Price/Sales or P/S) provides a simple approach: take the company’s market capitalization (the number of shares multiplied by the share price) and divide it by the company’s total sales over the past 12 months. The lower the ratio, the more attractive the investment.
Price to Earnings is the most usual way to compare the relative value of stocks based on earnings since you calculate it by taking the current price of the stock and divide it by the Earnings Per Share (EPS).
Definition: The amount of sales generated for every dollar’s worth of assets. It is calculated by dividing sales in dollars by assets in dollars. Formula: Asset Turnover = Revenue / Assets Also known as the Asset to Turnover Ratio. More Detail: Asset turnover measures a firm’s efficiency at using its assets in generating sales or revenue – the Read More…
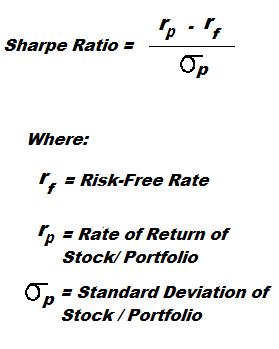
A Sharpe Ratio calculates the extra return you make compared to the extra risk you take on.
Current Ratio is the ratio of current assets divided by current liabilities. It provides A liquidity ratio that measures a company’s ability to pay short-term obligations. Also known as “liquidity ratio”, “cash asset ratio” and “cash ratio”.
Asset/Equity Ratio is the ratio of total assets divided by stockholders’ equity.
Quick Ratio is the ratio that measures the ability of a firm to cover its current liabilities with their most liquid current assets. Quick Ratio = (Current Assets – Inventory) / Current Liabilities
What are they doing with your money? Have you ever wondered how well your money is really being managed by the corporations you hand it over to? After all, the media is full of stories about CEO compensation reaching new heights, buy-outs of non-profitable holdings, million dollar birthday parties and other horror stories. Formula for Read More…
PE Ratio (Price-to-Earnings) is a valuation ratio that compares the price per share of a company’s stock to its earnings per share. It basically shows how much investors are willing to pay for a share given the earnings currently generated. It is also used to analyze whether a stock is overvalued or undervalued. Formula How Read More…
A Sharpe Ratio calculates the extra return of an investment in return for the extra risk taken on. It is used to compare different investments to see which one did better given the different risk of each. It is measured as taking the difference between a risk-free and a risky asset, and then dividing the difference by the Standard Deviation (which Read More…


