A covered call is an options insurance strategy where you simultaneously have an open position on a stock and sell a call option for the same symbol. Adding a short call in your open positions means that you are obligated to sell your stocks at the strike price contingent on the option buyer. However, you Read More…
A covered put is an options insurance strategy where you simultaneously have a short open position on a stock and sell a put option for the same underlying option. Adding a short put in your open positions means that you are obligated to buy your stocks at the strike price, contingent on the option buyer’s Read More…
A floor is an options insurance strategy where you simultaneously have a long open position on a stock and a long put for the same underlying asset. Adding a long put to your open position means that you are obligated to sell your stock at the strike price. The long put ensure that you can Read More…
A cap is an options protection strategy where you simultaneously have a short position on a stock and a long call for the same underlying asset. Adding a long call to your open position means that you are obligated to buy your stock at the strike price. However, you already have a short position on Read More…
A bull spread is a strategy where you simultaneously buy a long call at Strike Price 1, and sell a call for Strike Price 2. Recall that users will pocket the premium should the option not be exercised. By selling a call with a higher strike price, users can reduce their total transaction costs and Read More…
A bear spread is a strategy where you simultaneously sell a put at Strike Price 1, and buy a put at Strike Price 2. Recall that users will pocket the premium should the option not be exercised. By selling a put with a lower strike price, users can reduce their total transaction costs and create Read More…
A box spread is an option strategy that is created by combining the components of the bull spread and the bear spread. By creating a box spread, you are creating a neutral riskless position that generates a return like a bond. A box spread can be used to borrow or lend funds. What are its Read More…
A ratio is an option strategy that is created by having X amount of call options at Strike Price 1 and shorting Y amount of call options at Strike Price 2. By creating a ratio, you are creating an option strategy where you can reduce your total option costs by shorting more call options are a higher strike price. Read More…
A bullish collar is a protection strategy where you simultaneously buy a call at strike price 1 and sell a put at strike price 2. This strategy is for investors who has a bullish perception on the underlying asset. We can also create a “bearish” collar by simultaneously buying a put at strike price 1 Read More…
A straddle is a volatility bet where you simultaneously long a call at Strike Price 1 and long a put at Strike Price 1. This creates a triangular shaped payoff and profit graph where the reward is based on the volatility of the stock. Traders can also bet against volatility by shorting a call at Read More…
A strangle is a volatility bet where you simultaneously long a call at Strike Price 2 and long a put at Strike Price 1. You will notice that the difference with a straddle is the difference strike price for the long call. By buying a call with a higher strike price, you are buying a Read More…
A butterfly is a volatility bet that the trader can implement to protect against large fluctuations, or to gain on volatility. You will notice that a butterfly is almost like a straddle, with a difference in the edges. The traders can add additional contracts to his/her strategy to reduce the risk of large losses or Read More…
Short Put What is a short put? Recall that a put option is a contract where the buyer has the right (not the obligation) to exercise a sell transaction at a specific strike price before an expiration date. A short put is a term used when you sell a put option for an underlying asset. Read More…
Short Put Recall that a put option is a contract where the buyer has the right (not the obligation) to exercise a sell transaction at a specific strike price before an expiration date. A short put is a term used when you sell a put option for an underlying asset. A trader that has a Read More…
Recall that a call option is a contract where the buyer has the right (not the obligation) to exercise a buy transaction at a specific strike price at expiration date. A short call is a term used when you sell a call option for an underlying asset. A trader that has a short call option Read More…
A long call is a term used when you own a call option for an underlying asset. A call option is a contract where the buyer has the right (not the obligation) to exercise a buy transaction at a specific strike price at or before an expiration date. In the world of trading, owing a Read More…
Short Stock What is a short stock? A short stock is an expression used when you sold shares of a company that you did not own beforehand. Let’s say you expect a stock’s price to drop. Shorting a stock would involve a strategy where you borrow shares from another party (usually a broker) and sell Read More…
Long Stock What is a long stock? A long stock is an expression used when you own shares of a company. It represents a claim on the company’s assets and earnings. As you increase your holdings of a stock, your ownership stake in the company increases. Words such as “shares”, “equity” and “stock” all mean Read More…

Brokerages exist to allow individuals to make investments into the larger market. In other words, they connect individuals to the markets as a whole. Securities Brokers help individuals trade securities, the security type will change depending on the broker, but they usually fall into these categories: Cash (including Foreign Exchange markets) Individual Securities Bonds and Read More…

Your home will probably be the biggest purchase you make in your lifetime. Buying a home not only saves money on rent, but is a serious asset that can appreciate over time. Since homes are so expensive, (almost) no-one buys them in cash. Instead, homes are typically purchased with a special type of loan, called Read More…

Understanding financial solvency is as important to an investor as it is to a financial manager. Whether it’s having the money to pay off a friendly wager or having the capital to pay off a commercial loan, being solvent is necessary to achieve long-term success. Solvency is the possession of assets in excess of liabilities, Read More…
Future Options are exactly what their name implies – an option on a futures contract. Futures and Options – Related Derivatives Futures and options are both derivatives – meaning a security whose value solely depends on the value of the underlying asset. A future derives its value from the commodities or currencies which it represents Read More…

Options Spreads are option trading strategies which make use of combinations of buying and selling call and put options of the same or varying strike prices and expiration dates to achieve specific objectives (hedging, arbitrage, etc.). Option spreads are complex trades, but you can place two “legs” simultaneously using this trading platform. Trading Option Spreads To Read More…

“Unemployment” is a major economic indicator measuring how much of the working population is currently looking for a job. The unemployment rate is the most “tangible” economic indicator – if GDP is going up or down, it is harder for people to notice in their day-to-day lives. When the unemployment rate goes up, it usually Read More…

Definition “Price Controls” are artificial limits that are put on prices. If the limit is put in place to prevent prices from getting too high, they are called Ceilings. If they are in place to prevent the price from getting too low, they are called “Floors”. Price Ceilings Price Ceilings are controls put in place Read More…

What Are Interest Rates? Interest rates are growth rates – it is a percentage that is used to calculate how much a loan or investment grows over time. Interest rates are most commonly associated with borrowing money, like a homeowner taking out a mortgage or a government selling a bond. The interest rate is how Read More…

Definition Scarcity refers to the fact that resources are finite – people and organizations need to allocate their finite resources between their infinite wants. Each year, the world produces more goods and services, along with better technologies and processes that can increase output farther. Even with this growth, there will always be scarcity, because there Read More…

Definition “Specialization” is when a labor force begins to divide total production, leading to a rise of experts or specialists. This is called the Division of Labor, and it typically results in much higher productivity of labor. How Does It Work? Specialization has two main parts – Division of Labor, and a rise of Experts. Read More…

Definition “Opportunity Cost” is what needs to be given up to get something. This is different from an item’s price. Imagine you want to buy some stock for your virtual portfolio – you can afford one share of either Apple () or Alphabet, Inc. (). Your Opportunity Cost of buying one is that you cannot also Read More…
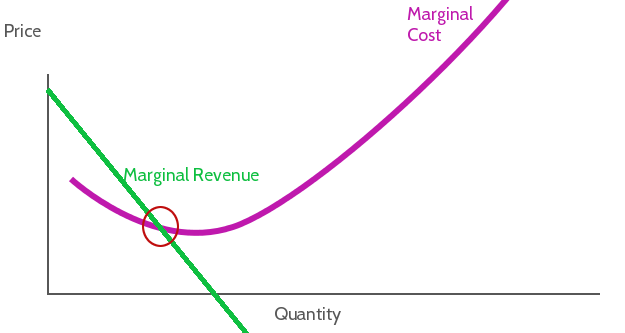
Everyone knows about costs and benefits of doing something – the pros and cons of making a choice. Marginal benefit and marginal cost are different – they look more closely at doing slightly more or less of different alternatives. Marginal costs and benefits are extremely important to producers when choosing their inputs and prices. [gtranslate] Read More…

What does it mean to be an Entrepreneur? An Entrepreneur is someone who takes a risk to start a new business. Nearly every business that exists (apart those created as spin-offs of other businesses, or by government intervention) was started by one or several entrepreneurs, who took a risk to launch a new company. Who becomes Read More…

Definition Economic Incentives includes anything that pushes people, businesses, and governments to do one thing or another. This includes what products you buy, what career you choose, what products businesses produce, and what government programs are put in place. Incentives for Individuals Each individual faces many economic incentives every day. If you are in school, Read More…

Definition In Economics, an “Externality” is a benefit or cost that is not reflected in the price of a good or service. Why do Externalities Exist? Prices are determined by the relationship between the supply and demand of a good or service (for details, see our article on Supply and Demand Examples in the Stock Read More…

Definition A “Contract” is a legally binding agreement between two parties (people, companies, or both). Having a contract means that if one party does not keep their word, the other can sue them in court to either force them to fulfill their side of the agreement, or pay back compensation. What Makes A Contract Binding? Read More…

When talking about Banking, people generally group Banks, Credit Unions, and Savings & Loan companies all in one group. They do provide similar services, but they each have specific differences that might make them a better or worse fit for your financial needs. What They Have In Common All three of these institutions can do Read More…

Definition of Spending Plan A “Spending Plan” is exactly as it says – a plan of what you will be spending each month. There are usually two parts – your “fixed” spending and your “variable” spending. The fixed part is usually the same every month, with things like rent/mortgage payments, grocery bills, insurance, and car Read More…
Definition When we think of money, stored value means anything that isn’t cash, but you can still use to transfer value – checks, debit cards, gift cards, and forms like that. These are used to transport some dollar amount which we can later exchange for goods and services. Each of these forms of stored value have their Read More…

Definition of Wealth “Wealth” means having an abundance of something desirable. This can be tangible, like money and property, or intangible, like good health or freedom. Intangible Wealth Just because something does not have a monetary value does not mean it is worthless. Having strong connections with friends and family is often considered a major Read More…

As you begin working with financial institutions to secure your money and process your financial transactions, it is important that you learn to keep good financial records. These records, both on paper and electronic, will allow you to know where your money and assets are and exactly how much you have at a given time. Read More…

Definition “Major Economic Indicators” are numbers that you can look at to try to get a picture of how well the economy is doing. Different indicators measure different parts of the economy, but their main characteristic is that they measure the same thing in the same way over time. This means that you can compare the Read More…

The stock market determines prices by constantly-shifting movements in the supply and demand for stocks. The price and quantity where supply are equal is called “Market Equilibrium”, and one major role of stock exchanges is to help facilitate this balance. We can use the stock market to give some great supply and demand examples with Read More…

Definition In Economics, “Demand” is the relationship between prices and how much people want to buy a good or service. Details As the market price of a good goes up, the amount of that good that people are willing to pay generally goes down. This is because each person puts some value on the good – Read More…
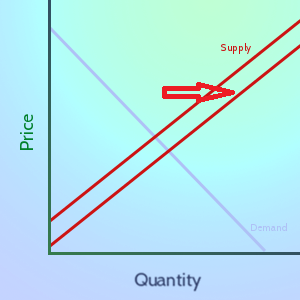
Definition In Economics, “Supply” means the relationship between prices and production. In general, the higher the market price of a good or service is, the more producers are willing to sell of it. Details As the market price for a good goes up, companies want to sell more of it to try to make greater profits. Read More…

Comparing Economic Systems There are many different economic systems that try to result in more equality or faster growth. The structure of a country’s economy has a lot to do with the country’s politics and the values of its population. However, the economy of every country also changes over time, and how it falls between Read More…

Definition The Federal Reserve Bank, or the “Fed”, is the central banking system of the United States. It serves as the primary regulator of the US dollar, as well as the “lender of last resort” for other banks. Regulating Currency The Federal Reserve works to maintain the interest rates that banks use to lend money to Read More…

Definition The Reserve Requirement is how much of all deposits that a bank is required to keep “on hand”, meaning in its vaults, or on deposit at the Federal Reserve Bank (in the United States). Details The “Reserve Requirement” is about 10% of all money that has been deposited at a bank. Because of how Read More…

Definition The stock market crash of 1929 was a massive crash in stock prices on the New York Stock Exchange, and marks the largest financial crash in the United States. Details The stock market crash came in multiple parts – the initial crash on October 28 (a 12.87% drop) continued into October 29 (a 11.73% drop), Read More…
How Is Money Created? In the United States (and many other countries), the question “How is money created?” comes up a lot. The treasury isn’t just printing cash all day, if they were the government debt would be zero! In the US, money is created as a form of debt. Banks create loans for people Read More…

Definition Cottage Industry, or the “Putting Out System” is a production system of producing goods that relies on producing goods, or parts of goods, by craftsmen at home, or small workshops, instead of large factories. History The contractors would then create the goods at home, or their “cottage”, and deliver them upon completion. The major Read More…

Definition “OHLC” stands for “Open, High, Low, Close”, and this is a chart designed to help illustrate the movement of a stock’s price over time (typically a trading day, hour, or minute) Details OHLC charts are also known as “Bar Charts” because they display the information as a series of line segments instead of as Read More…

Definition Spot and Futures contracts are a standardized, transferable legal agreement to make or take delivery of a specified amount of a certain commodity, currency, or an asset at the current date. The price is determined when the agreement is made. The only difference between spots and futures is the delivery date. The current date Read More…
Definition Futures Contracts are a standardized, transferable legal agreement to make or take delivery of a specified amount of a certain commodity, currency, or an asset at the end of specified time frame. The price is determined when the agreement is made. Here are some useful terms for futures: Contract Size: This specifies the number Read More…

What are options? An option gives the owner the right, but not the obligation, to buy or sell the underlying instrument(we assume stocks here) at a specified price(strike price) on or before a specified date(exercise date) in the future. (this is different for European options as they can only be exercised at the end date). Read More…
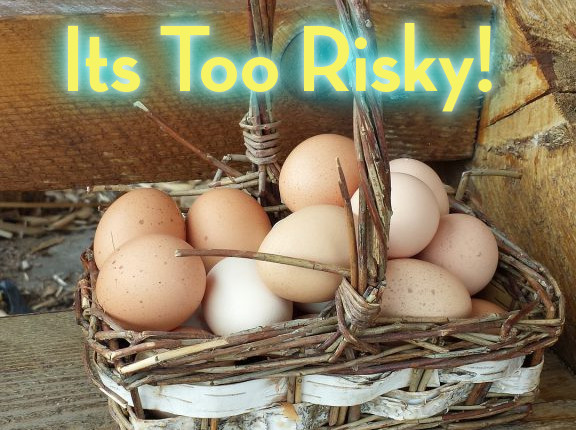
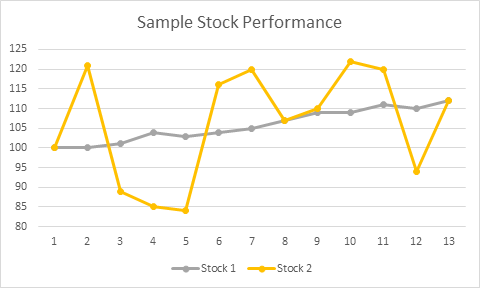
How Do I Build a Diversified Portfolio? Understanding what it means to build a diversified portfolio is one of the first concepts a new investor needs to understand. When talking about stocks, diversification means to make sure you don’t “put all of your eggs in one basket.” What Does It Mean To Diversify? Simply put, Read More…

Definition A stock quote gives essential information about a particular stock at a point in time. The quote normally includes information such as the name of the company, the ticker symbol, the price, the day’s high and low prices, and the trading volume. Details Usually when you get a stock quote, you see lots of Read More…

Definition: A “Ticker Symbol” is a unique one to five letter code used by the stock exchanges to identify a company. It is called a ticker symbol because the stock quotes used to be printed on a ticker tape machine that looked like the images below. When it printed the stock quotes, it made a tick-tick-tick Read More…
Definition: “Wall Street” is a street in New York City, near the southern end of Manhattan Island. It is the home of the New York Stock Exchange, and the biggest center of stock trading and finance in the world. History Before New York was New York, it was a Dutch colony called New Amsterdam, which Read More…

Definition: The New York Stock Exchange (or NYSE) is the largest stock exchange in the world. Think of it as an organized, fast-paced flea market where buyers and sellers from all over the world come to trade U.S. stocks (and now some foreign shares as well). It is where over 2,800 of the biggest U.S. Read More…
What is a Stock? Stock is defined as a share of ownership in a company. If you own a company’s stock, you own a percentage of the company itself. This includes partial ownership of its assets (like equipment, vehicles, and buildings) and partial ownership if its income and profits. The main reason people purchase stock Read More…

Mutual Funds are a way you can buy into a wide range of stocks, bonds, money markets, or other securities all at once. They are professionally managed, so you are basically buying a piece of a larger portfolio. Definition Mutual Funds come in several different “flavors”, but the core concept is always the same: the Read More…

ETFs are a fairly new way that you can buy a large group of stocks, assets, or other securities all at once. ETFs trade just like stock; you can buy and sell shares of an ETF throughout the day on an exchange. Definition “ETF” stands for “Exchange Traded Fund”, which is exactly how it sounds; Read More…
Definition: The Dow Jones Industrial Average, more frequently known as the Dow or the Dow Jones, is a stock market index made up of 30 of the largest publicly-owned companies based in the United States. It’s a price weighted index meaning that the index’s price is an average of the price of the 30 stocks Read More…

What is a Balance Sheet? The Balance Sheet (or Statement of Financial Position) is one of the four financial statements required by the SEC based on the U.S. GAAP (Generally Accepted Accounting Principles). According to the SEC, the Statement of Financial Position presents “detailed information about a company’s assets, liabilities and shareholders’ equity.” In other Read More…

Definition: The Income Statement is one of the financial statements that all publicly traded companies share with their investors. The income statement shows the company’s sales, expenses, and net profit (or loss) over a period of time–usually 3 months, year-to-date, and twelve months. The income statement also comes with a lot of notes and discussions Read More…

Fibonacci Arc is a technical analysis indicator and is utilized to give hidden support and resistance levels for security. It is built by drawing a trend line between two swing points on a chart.

Live Forex trading includes negotiating of national bills which is performed on a live basis at 24 hour, around-the-clock period. Forex is derived from the words Foreign Exchange which is known as the global market that does business in money trading.
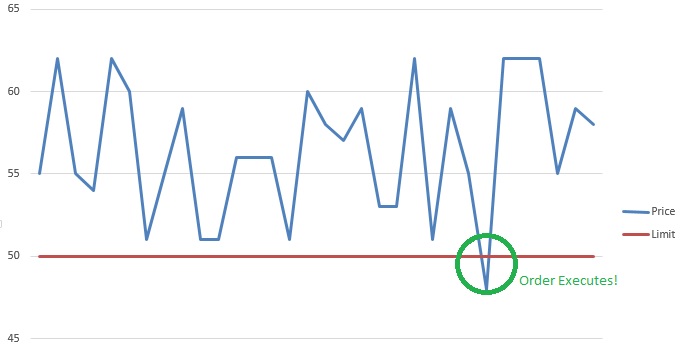
Definition A Stop (or stop loss) order and limit order are orders that try to execute (meaning become a market order) when a certain price threshold is reached. Limit and stop orders are mirrors of each other; they have the same mechanics, but have opposite triggers. When creating a limit or stop order, you will select Read More…

Definition An order type that allows to set a moving stop or limit target price. The target price moves based on the daily high. Trailing stops can be set either in percentage or in dollars and cents terms. When in dollar terms it will activate when the price has moved by the target you have Read More…

Promissory notes issued by a corporation or government to its lenders, usually with a specified amount of interest for a specified length of time. This is seen as a loan from the bond holder to the corporation. The value of Bonds traded are greater than the value of stocks traded.
Definition Your “Risk Level” is how much risk you are willing to accept to get a certain level of reward; riskier stocks are both the ones that can lose the most or gain the most over time. Risk Understanding the level of risk you need and want is a very important part of selecting a Read More…

Definition: An asset is anything that has monetary value and can be sold. Assets can be anything from a pencil (though it is not worth much) to a skyscraper to things like Stocks and ETFs. There can also be intangible assets such as the value of a brand name or logo. Details: Assets generally refer Read More…

Definition “Asset Allocation” is how you have divided up your investments across different assets. You can have all your assets in one place, or you can use diversification to spread them around to reduce risk. Details Whenever you pick stocks, open a bank account, get paid, buy something, or do anything with any resources, you Read More…

An investment strategy is the set of rules and behaviors that you can adopt to reach your financial and investing goals. Choosing an investing strategy can be a daunting task when you are starting to learn about investments and finance. Here we will look at the larger overall strategies rather than very specific strategies. Given Read More…

In finance, Volume-Weighted Average Price (VWAP) is a ratio of the profit traded to complete volume traded over a distinct time horizon – normally one day. It’s a portion of the average price a stock traded at over the trading horizon.

Definition Open Interest is the total number of options or futures contracts that are “open”, meaning currently owned by an investor and not yet expired. Details Think first in terms of options contracts: by owning an option, it signifies that there is interest in actually trading that stock, although at a different price. Since this Read More…
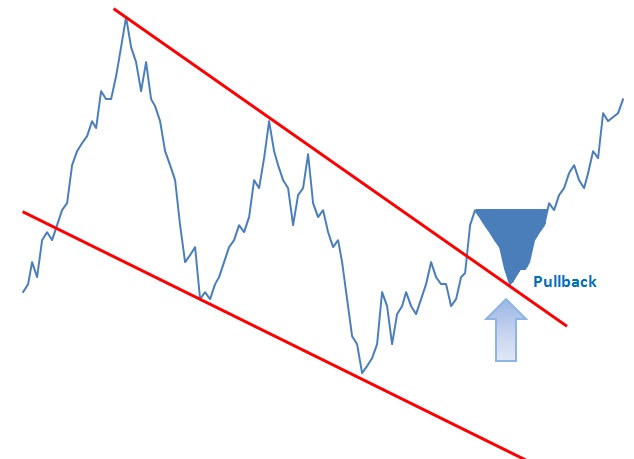
A pullback is a technical analysis term used frequently when a stock “pulls” back to a resistance and/or support line, usually after a breakout has occurred. Pullbacks can be in an uptrend or downtrend and can pull back upwards or downwards. In the example below we can see a pullback as it retraces back to Read More…

Definition When you are looking at a sequence of related numbers (for example, the price of a single stock over time, the height of all students in a classroom, or how many breakfasts you will get out of a box of a particular cereal), the “variance” is how far away the numbers get from the Read More…

Good Till Date Order Terms If you have ever placed a limit or stop order, you have see the “Good Till Day” order term on the trading menu: A “Good-Till-Day” order is simply one that will cancel at the end of the trading day if it does not fill. So, for example, if you have Read More…
Sharpe Ratio for Beginners Introduction The Sharpe Ratio is an important tool for evaluating a stock, or a portfolio, based on how risky it is to get a higher return. You can use the Sharpe Ratio to determine how consistent the returns of a stock or portfolio are, so you can determine if the returns Read More…

The head-and-shoulders pattern is one of the most popular chart patterns in technical analysis. The pattern looks like a head (the middle peak) with two shoulders (two equal heiight peaks).

The Moving Average Convergence-Divergence (MACD) indicator is one of the easiest and most efficient momentum indicators you can get. It was developed by Gerald Appel in the late seventies. The MACD moves two trend following indicators and moving averages into a momentum oscillator by subtracting the longer moving average from the shorter moving average. The Read More…

Fixed income analysis is the process of evaluating and analyzing fixed income securities for investment purposes. Fixed Income represents a distinct asset class. Investors and analysts perform fixed-income analysis to Evaluate the risk characteristics underlying debt securities and to assess the capacity of the borrowing entity to meet its financial obligations (credit analysis) Identify which Read More…
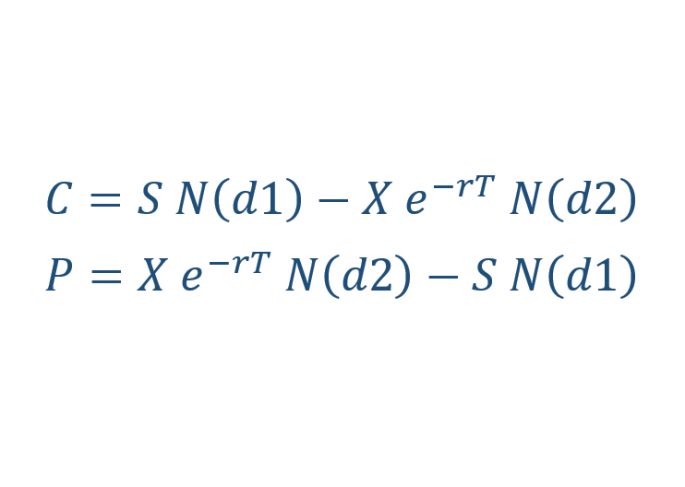
Introduction The Black-Scholes formula is the most popular ways to calculate the true price of an option. It is easy to calculate the intrinsic value, but the extrinsic value can be very tricky to calculate. Black Scholes is used for calculating two types of options. Options on stocks Stock Options. Fisher Black, Robert Merton and Read More…

Definition: The simultaneous purchase of a security on one stock market and the sale of the same security on another stock market at prices which yield a profit. In Depth Description: In economics and finance, arbitrage is the practice of taking advantage of a price difference between two or more markets: striking a combination of Read More…

Over-The-Counter (OTC) Stocks Most investors are familiar with NASDAQ, the NYSE (New York Stock Exchange), TSX (Toronto Stock Exchange), and most other large national stock exchanges. However, there are also thousands of companies that want to sell shares to the general public, but are not able to sell on these exchanges. Stock traded on these Read More…

Gross National Product is the value of all goods and services produced by a country’s residents.
Free Cash flow is the cash available to all the capital providers of a company. There are two types of free cash flows: 1) Cash flow available to pay out to all capital providers and 2) Free Cash Flow to Equity (FCFE).

The Form-8K is a SEC-mandated report filed by public companies to report unexpected events or transactions that are material in nature, and thus have an impact on the share prices of the company.
The earnings reports released by companies can be invaluable in providing such information. Released by public companies on a quarterly and annual basis, they can be used to assess and gauge a company’s: financial condition, strategic plans, industry and competitive position, Key performance drivers and risk factors and Future performance.

Discounted Cash Flow is a valuation technique or model that discounts the future cash flows of a business, entity, or asset for the purposes of determining its value. One aspect of investment decision-making entails discovering the fair value of investments.

Covariance is a statistical measure of the extent that 2 variables move in tandem relative to their respective mean (or average) values. In the investment world, it is important to be able to measure how different financial variables interact together.

The use of correlation analysis extends to numerous important fields. For example, in finance, correlation analysis can be used to measure the degree of linear relationships between interest rates and stock returns, money supply and inflation, stock and bond returns, and exchange rates.

Comprehensive insurance to a form of insurance policy which includes a broad range of coverage or protection.
The CME Group is an order-driven exchange that facilitates the trading of forward, futures, and options contracts on numerous products within key asset classes such as agriculture, energy, metals, equities, interest rates, and exchange rates.
The CBOT is an exchange providing trading in derivatives contracts and clearinghouse functions. It allows traders to buy and sell contracts on several products in asset classes such as agriculture, energy, metals, equities, bonds, and exchange rates. The majority of its trades are conducted electronically.
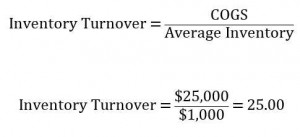
Measuring the cash conversion cycle is important to liquidity, working capital, and the operating cycle of a company. Good management of the CCC can also enhance a company’s cash flows, allowing it to effectively make sound investing and financing decision. Managing the CCC entails efficient inventory, receivables, and payables functions, and should be part of a company’s overall operational strategy.
Capital funding is the provision of monetary resources or capital for productive uses. Capital provided by investors or other parties is used by various entities such as governments, companies, organizations, and individuals in order to fund their functions and operations. In most cases, capital provided is compensated by some form of return to the provider. Two important types of capital are equity and debt. Equity capital represents an ownership stake, while debt capital is a form of lending.

Account Receivables Management refers to the set of policies, procedures, and practices employed by a company with respect to managing sales offered on credit.
Account Payables Management refers to the set of policies, procedures, and practices employed by a company with respect to managing its trade credit purchases.

Insurance is protection from losing or damaging something. It is defined as the transfer of loss risk in exchange for payment. Basically, if we damage or lose something that was insured, the insurance will cover the cost of having it fixed or replaced.