Every year or two, most of us go to the doctor’s office to receive a check-up on the state of our physical health. The doctor typically checks several measurements (height, weight, blood pressure, etc.) in order to gauge how our health has progressed over the past year. They can then use their results to determine Read More…
What is a Balance Sheet? The Balance Sheet (or Statement of Financial Position) is one of the four financial statements required by the SEC based on the U.S. GAAP (Generally Accepted Accounting Principles). According to the SEC, the Statement of Financial Position presents “detailed information about a company’s assets, liabilities and shareholders’ equity.” In other Read More…
Definition: The Income Statement is one of the financial statements that all publicly traded companies share with their investors. The income statement shows the company’s sales, expenses, and net profit (or loss) over a period of time–usually 3 months, year-to-date, and twelve months. The income statement also comes with a lot of notes and discussions Read More…
Definition “Asset Allocation” is how you have divided up your investments across different assets. You can have all your assets in one place, or you can use diversification to spread them around to reduce risk. Details Whenever you pick stocks, open a bank account, get paid, buy something, or do anything with any resources, you Read More…
The Moving Average Convergence-Divergence (MACD) indicator is one of the easiest and most efficient momentum indicators you can get. It was developed by Gerald Appel in the late seventies. The MACD moves two trend following indicators and moving averages into a momentum oscillator by subtracting the longer moving average from the shorter moving average. The Read More…
Introduction The Black-Scholes formula is the most popular ways to calculate the true price of an option. It is easy to calculate the intrinsic value, but the extrinsic value can be very tricky to calculate. Black Scholes is used for calculating two types of options. Options on stocks Stock Options. Fisher Black, Robert Merton and Read More…
Free Cash flow is the cash available to all the capital providers of a company. There are two types of free cash flows: 1) Cash flow available to pay out to all capital providers and 2) Free Cash Flow to Equity (FCFE).
The Form-8K is a SEC-mandated report filed by public companies to report unexpected events or transactions that are material in nature, and thus have an impact on the share prices of the company.
Fixed income analysis is the process of evaluating and analyzing fixed income securities for investment purposes.
Discounted Cash Flow is a valuation technique or model that discounts the future cash flows of a business, entity, or asset for the purposes of determining its value. One aspect of investment decision-making entails discovering the fair value of investments.
Covariance is a statistical measure of the extent that 2 variables move in tandem relative to their respective mean (or average) values. In the investment world, it is important to be able to measure how different financial variables interact together.
Account Receivables Management refers to the set of policies, procedures, and practices employed by a company with respect to managing sales offered on credit.
Account Payables Management refers to the set of policies, procedures, and practices employed by a company with respect to managing its trade credit purchases.
Modern Portfolio Theory (MPT) is an investment theory whose purpose is to maximize a portfolio’s expected return by altering and selecting the proportions of the various assets in the portfolio.
If you own a bond or manage a bond portfolio, chances are that will you be following daily interest rates. You know that bond prices increase when rates rise, and decrease when rates fall. But how do you measure the bond’s price sensitivity to such rate fluctuations? The answer is duration.
Dupont Analysis breaks the Return on Equity into several different components in order to analyze where the returns are coming from.
Depreciation refers to the gradual and permanent decrease in value of the assets of a firm, nation or individual over its lifetime.
The price-to-sales ratio (Price/Sales or P/S) provides a simple approach: take the company’s market capitalization (the number of shares multiplied by the share price) and divide it by the company’s total sales over the past 12 months. The lower the ratio, the more attractive the investment.
Price to Earnings is the most usual way to compare the relative value of stocks based on earnings since you calculate it by taking the current price of the stock and divide it by the Earnings Per Share (EPS).
In the world of stock analysis, fundamental and technical analysis are on completely opposite sides of the spectrum. Earnings, expenses, assets and liabilities are all important characteristics to fundamental analysts, whereas technical analysts could not care less about these numbers and only focus on price and volume.
Definition: The amount of sales generated for every dollar’s worth of assets. It is calculated by dividing sales in dollars by assets in dollars. Formula: Asset Turnover = Revenue / Assets Also known as the Asset to Turnover Ratio. More Detail: Asset turnover measures a firm’s efficiency at using its assets in generating sales or revenue – the Read More…
A revenue or expense stream that changes a cash account over a given period. Cash inflows usually arise from one of three activities – financing, operations or investing – although this also occurs as a result of donations or gifts in the case of personal finance. Cash outflows result from expenses or investments. This holds true for both business and personal finance.
Fundamental analysis is the process of looking at the basic or fundamental financial level of a business, especially sales, earnings, growth potential, assets, debt, management, products, and competition.
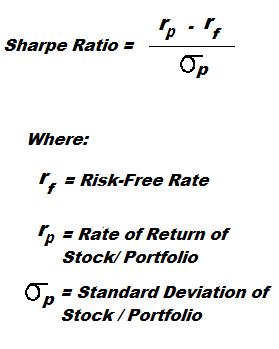
A Sharpe Ratio calculates the extra return you make compared to the extra risk you take on.
Capital Asset Pricing Model (CAPM) is a method used by investors to prioritize what stocks to invest in, given their limited cash.
Form 10-Q, is also known as a 10-Q or 10Q, is a quarterly report mandated by the United States federal Securities and Exchange Commission, to be filed by publicly traded corporations.
Companies with more than $10 million in assets and a class of equity securities that is held by more than 500 owners must file annual and other periodic reports, regardless of whether the securities are publicly or privately traded. Up until March 16, 2009, smaller companies could use Form 10-KSB. If a shareholder requests a company’s Form 10-K, the company must provide a copy. In addition, most large companies must disclose on Form 10-K whether the company makes its periodic and current reports available, free of charge, on its website. Form 10-K, as well as other SEC filings may be searched at the EDGAR database on the SEC’s website.
A financial ratio that shows how much a company pays out in dividends each year relative to its share price. In the absence of any capital gains, the dividend yield is the return on investment for a stock. The formula is Annual Dividends Per Share divided by Price Per Share.
Current Ratio is the ratio of current assets divided by current liabilities. It provides A liquidity ratio that measures a company’s ability to pay short-term obligations. Also known as “liquidity ratio”, “cash asset ratio” and “cash ratio”.
Asset/Equity Ratio is the ratio of total assets divided by stockholders’ equity.
Quick Ratio is the ratio that measures the ability of a firm to cover its current liabilities with their most liquid current assets. Quick Ratio = (Current Assets – Inventory) / Current Liabilities
What are they doing with your money? Have you ever wondered how well your money is really being managed by the corporations you hand it over to? After all, the media is full of stories about CEO compensation reaching new heights, buy-outs of non-profitable holdings, million dollar birthday parties and other horror stories. Formula for Read More…
A Cash Flow Statement is a financial statement that shows the flow of cash in and out of the business. The Cash Flow Statement is particularly useful for investors and lenders to determine the short-term viability of a company with respect to its ability to pay its debts. In the statement, money coming in to Read More…
EPS (Earnings-Per-Share) measures how much of a company’s net income actually trickles down to each outstanding share. Any preferred dividends are first taken out of the net income before calculating EPS. Interpreting EPS Earnings Per Share can be used to compare the earnings of two or more companies in a similar industry. Just because one Read More…
PE Ratio (Price-to-Earnings) is a valuation ratio that compares the price per share of a company’s stock to its earnings per share. It basically shows how much investors are willing to pay for a share given the earnings currently generated. It is also used to analyze whether a stock is overvalued or undervalued. Formula How Read More…
A Sharpe Ratio calculates the extra return of an investment in return for the extra risk taken on. It is used to compare different investments to see which one did better given the different risk of each. It is measured as taking the difference between a risk-free and a risky asset, and then dividing the difference by the Standard Deviation (which Read More…
Fundamental analysis is the process of looking at the basic or fundamental financial level of a business, especially: sales earnings growth potential assets debt management products competition This type of analysis examines key ratios of a business to determine its financial health and gives you an idea of the value its stock. Many investors use Read More…


