
Price ceiling is a government-mandated limit on the price that can be charged for a given product, such as a utility or electricity. The intended purpose of a price ceiling is to protect the consumers from conditions that would make a vital product from being financially unattainable for consumers.

A “Poison Pill” creates a strong defense mechanism for a “targeted takeover company” allowing the company to properly identify legitimate and beneficial acquisitions and weed out the actions of corporate raiders. The “Poison Pill” is also useful in slowing down the speed of potential raids.

A straddle is an investment strategy that involves the purchase or sale of an option allowing the investor to profit regardless of the direction of movement of the underlying asset, usually a stock.

An oligopoly is characterized by a small number of sellers who dominate an entire market.
Monopoly, in economic terms, is used to refer to a specific company or individual has a large enough control of a particular product or service that allows them to influence it’s price or certain characteristics.

Monopolistic Competition is characterized as a form of imperfect competition.

Money supply is the total amount of money available in an economy at any particular point in time.

Monetary Policy refers to the process by which the Monetary Authority of a given country implements a variety of measures to control the supply of money.

Fiscal policy is the use of government spending to influence the economy.

The Expected Return is a weighted-average outcome used by portfolio managers and investors to calculate the value of an individual stock, or an entire stock portfolio.

Elasticity is one of the most important terms in economics, and has a plethora of uses. Economists define elasticity as the ratio of the percent change in one variable to the percent change in another valuable.

If you own a bond or manage a bond portfolio, chances are that will you be following daily interest rates. You know that bond prices increase when rates rise, and decrease when rates fall. But how do you measure the bond’s price sensitivity to such rate fluctuations? The answer is duration.

Dupont Analysis breaks the Return on Equity into several different components in order to analyze where the returns are coming from.

Straight line depreciation is the most commonly used and simplest form of depreciation.

Depreciation refers to the gradual and permanent decrease in value of the assets of a firm, nation or individual over its lifetime.
A basic material used in manufacturing or commerce that is interchangeable with other the same commodities coming from a different source. The quality of a specific commodity may differ slightly, but it is essentially uniform across producers. When they are traded on an exchange, commodities must also meet specified minimum standards, also known as a basis grade. Typical types of commodities are corn, gold, silver, steel, etc.
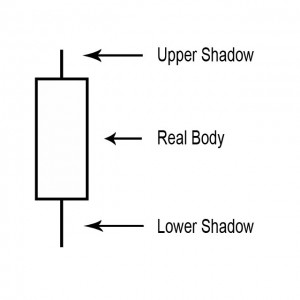
A point on a candle stick chart representing a specific time period (a day, an hour, a minute, etc) in which the underlying stock price has moved. Candlesticks will have a body and usually two wicks – one on each end. For a white (could also be green) candlestick, the bottom of the body represents the opening price and the top of the body represents the closing price. For red candlesticks, it is just the other way around. The top and bottom tips of each wick are the day’s highest and lowest price respectively.
A small line (like a candle wick) found at the top or bottom of an individual candle in a candlestick chart.

An investment strategy that aims to capitalize on the continuance of existing trends in the market. The momentum investor believes that large increases in the price of a security will be followed by additional gains and vice versa for declining values.
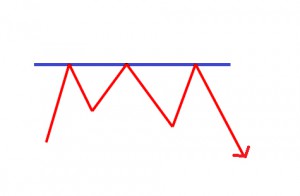
A point or range in a chart that caps an increase in the price of a stock or index over a period of time. An area of resistance, resistance line or resistance level indicates that the stock or index is finding it difficult to break through it, and may head lower shortly. The more times that the stock or index tries unsuccessfully to break through the resistance line, the stronger that area of price resistance becomes.

The price-to-sales ratio (Price/Sales or P/S) provides a simple approach: take the company’s market capitalization (the number of shares multiplied by the share price) and divide it by the company’s total sales over the past 12 months. The lower the ratio, the more attractive the investment.

High inflation and high unemployment occurring simultaneously.

A security with a guarantee of a return rate that is higher than the rate of inflation if it is held to maturity

The fee charged by a broker or investment advisor in exchange for investment advice and/or handling the purchase or sale of a security. Commissions vary from brokerage to brokerage.

When an investor takes an account with a licensed brokerage firm that allows the investor to deposit money and place investment orders through the brokerage firm. There are several different types of brokerage accounts. Full-service brokers provide investment advice and charges high fees for their services. Most online brokers provide less services at a far Read More…

Earnings estimates provide one strong measure of potential future performance and are a mainstay of stock investing research.

Return on Equity (ROE) is used to measure how much profit a company is able to generate from the money invested by shareholders.

Price to Earnings is the most usual way to compare the relative value of stocks based on earnings since you calculate it by taking the current price of the stock and divide it by the Earnings Per Share (EPS).
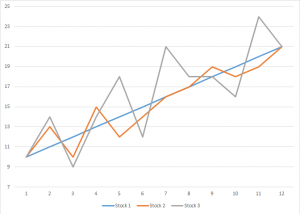
Stock volatility information can be used in many different ways but here is a quick and easy bit of stock volatility information that you can begin using today.
A hedge fund is one of the investment tools you will aspire toward as a serious investor. The first hedge fund came out in 1949 as a strategy to neutralize the effect of overall market movements on a portfolio.

Small cap stock investing is volatile. That is one of first things you should know and understand. So, why risk your money by investing in what is typically considered risky business?

Hyperinflation refers to out of control or extremely rapid inflation, where prices increase so quickly that the concept of real inflation becomes meaningless.

Inflation refers to the general rising of prices for goods and services in the economy, due to an increase in the amount of money and/or credit available.

A CD or Certificate of Deposit is one of the safest and liquid forms of investment available. Insured by the FDIC (Federal Deposit Insurance Corporation), CDs are a type of interest earning deposit account.

In a cap-weighted index, large price moves in the largest components (companies) can have a dramatic effect on the value of the index.
Market risk is a measure of how much of a loss an investor is facing while trading.
Your ideal investment or investment portfolio gives you the most opportunity for the risk you can bear. In this sense, it is important to understand the risk inherent in an investment before you look for the opportunity.

The buy and hold strategy is essentially just what it sounds like: Purchase stocks and then hold them for an extended period of time. The underlying assumption for the buy and hold strategy is that stocks tend to go up in price over extended periods of time.

Everywhere you turn there is another proprietary stock market timing system being sold. Let’s take a few minutes to review these claims against common sense.

It is only an offer and will not be accepted if the seller is not willing to let go at the offer price. This offer price pertains to all traded investments.

The difference between the ask price and the sell price is called the “spread” and it is kept by the broker.

If you are brand new to investing then take time to understand what you are reading when viewing a Stock Exchange Symbol and learn Stock Market Investing Basics.

Many people start trading stocks and never learn about stock trading risk management. The one’s that do learn, usually learn after they have been trading for a while, not before they start trading.

A REIT or Real Estate Investment Trust may be the perfect investment vehicle. REITs own, and often operate, real estate but are publicly traded like stock.

The U.S. Dollar has lost more than 30 percent of its value relative to other world currencies. Shorting the U.S. dollar and buying other world currencies is one way to make money from this trend.
By measuring the compilation of similar stocks instead of just one or two stocks, a stock index provides information about that particular market or segment.
A non-bank organization that regularly trades large blocks of stocks.

A national government that owes money to international financial institutions such as the World Bank, foreign governments, or to foreign lenders.

Many stock analysts have identified market trends related to specific times of the year. The success ratios of these trends are often far stronger than most other indicators.

A technical analysis indicator that compares advancing and declining stock issues and trading volume as an indicator of overall market sentiment. The Arms Index, or TRIN (Traders Index), is used as a predictor of future price movements in the market primarily on an intraday basis.

A market indicator used to determine volatility levels in the market without factoring in price direction. It is calculated by taking the absolute value of the difference between the number of advancing issues and the number of declining issues. Typically, large numbers suggest volatility is increasing, which is likely to cause significant changes in stock prices in the coming weeks.

A technical analysis tool that represents the total difference between the number of advancing and declining security prices. This index is considered one of the best indicators of market movements as a whole. Stock indexes such as the Dow Jones Industrial Average only tell us the strength of 30 stocks, whereas the advance/decline index can provide much more insight into the movements of the market.

By aggregating the value of a related group of stocks or other investment vehicles together and expressing their total values against a base value from a specific date. Market indexes help to represent an entire stock market and thus give investors a way to monitor the market’s changes over time.

Simplest, oldest, and most common form of business ownership in which only one individual acquires all the benefits and risks of running an enterprise. In a sole-proprietorship there is no legal distinction between the assets and liabilities of a business and those of its owner. It is by far the most popular business structure for startups because of its ease of formation, least record keeping, minimal regulatory controls, and avoidance of double taxation.

Definition The minimum amount of equity that must be maintained in a margin account. In the context of the NYSE and FINRA, after an investor has bought securities on margin, the minimum required level of margin is 25% of the total market value of the securities in the margin account. Keep in mind that this Read More…
Margin calls happen when your account value drops to a value below that allowed by a broker.

An entity that abides by specific legal requirements that sets it apart as having a legal existence, as an entity separate and distinct from its stockholders (owners).

Retained earnings is calculated by adding net income to (or subtracting any net losses from) the beginning retained earnings and then subtracting the dividends that were paid to shareholders
A plan offered by a corporation that allows investors to reinvest their cash dividends by purchasing additional shares or fractional shares on the dividend payment date.

Chart analysis is the same as Technical Analysis. It is mostly concerned with price and volume.
The Fed is the US central-banking system which is made up of 12 regional central banks

State regulations governing the sale of securities and mutual funds
Definition: An investment service that allows individuals to purchase a stock directly from a company or through a transfer agent. Not all companies offer DSPPs and the plans often have restrictions on when an individual can purchase shares. Example: The greatest benefit of using direct stock purchase plans for investors is the ability to avoid commissions by not Read More…
A phrase used for a stock where the price has dropped significantly in a short period of time. A falling knife security can rebound, or it can lose all of its value where the shares become worthless.

The total amount that the federal government has borrowed including internal debt (borrowed from national creditors) and external debt (borrowed from foreign creditors).
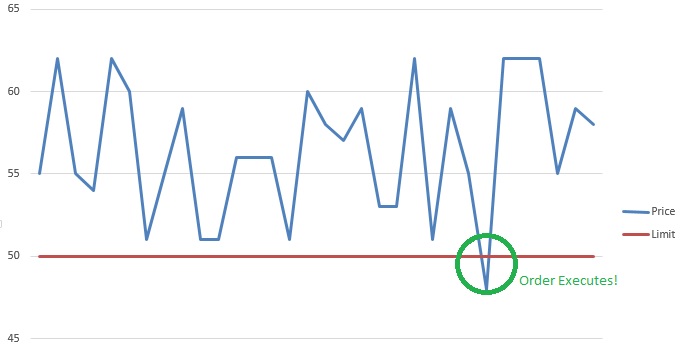
A Stop Limit is an order that combines the features of stop order with the features of a limit order. A stop limit order executes at a specified price (or better) after a specified stop price is reached. After the stop price is reached, the stop limit order becomes a limit order to buy (or sell) at the limit price or better.

The merger of companies at the same stage of production in the same or different industries.
US federal legislation of 1890 that prohibited the creation of monopolies by outlawing direct or indirect attempts to interfere with the free and competitive nature of the production and distribution of goods. Amended by the Clayton Act of 1914. Also called Sherman Act.

An order to buy or sell a stock at a fixed price. This order is active until 1) the trade is executed, 2) the investor decides to cancel it or 3) a specified time period elapses.

Decreasing the long-run average and marginal costs that come from an increase in the size of a factory or plant.

A short call option position where the writer does not own the specified number of shares specified by the option nor has deposited cash equal to the exercise value of the call.

A high-risk bond with a low credit rating. Junk Bonds usually have a much higher yield than investment-grade bonds.

An alternative retirement plan to a 401(k) plan offered by non-profit organizations such as universities and charitable organizations, rather than corporations.

When a company offers to trade one security in return for another security.

Resistance and support levels are widely used by experienced traders to formulate trading strategies. For example, if a stock is approaching a very strong resistance level, a trader may prefer to close the position rather than take the risk of a significant decline if the stock uptrend reverses.

Analysis of ADX is a method of evaluating trend and can help traders to choose the strongest trends and also how to let profits run when the trend is strong.
If you perform four or more day trades in a 5 day period you may get flagged by the SEC as a “Pattern Day Trader.” This can cause you to lose your margin account status until you deposit enough cash to have $25,000 or more in your account. Many beginning traders have been bitten by this rule!

A trading term called a dead cat bounce is used to when a stock is in a severe decline and has a sharp bounce off the lows. It occurs due to the huge amount of short interest in the market. Once the supply and demand has become unbalanced, any type of bear market rally will create a massive short covering which will lead to a swift price move up. This bounce will be short lived and followed up by heavy selling which will break the prior price low.

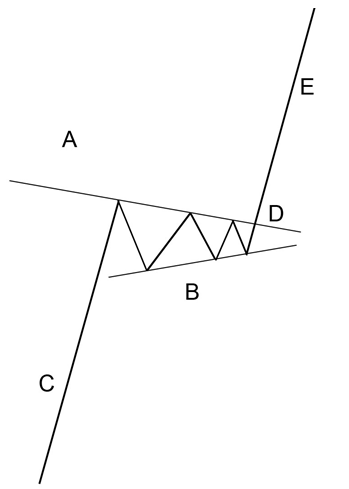
The ascending triangle is a bullish continuation pattern. This pattern is made by two converging lines. The first line is an upward slant which is the support and the other is a horizontal resistance line. To validate the ascending triangle, there has to be an oscillation between the two lines. Each line has to be Read More…
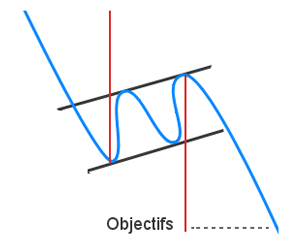
The pennant resembles the symmetrical triangle, but it’s characteristics are not the same. The pennants is shaped like a wedge of consolidation. Its normally appears after a sudden upward or downward movement. The life of a pennant is short according to the time frame used.
An ascending flag is a continuation pattern. The ascending flag is formed by two straight upward parallel lines which are shaped like a rectangle. It is adjusted in the direction of the trend that it consolidates. Contrary to a bullish channel, this pattern is quite short term and marks the fact the seller will need a break.

Charting Software is an analytical, computer-based tool used to help equity (stock) traders with trading analysis by charting the price stock price for various time periods along with various indicators. Equity charting software packages are used by many traders to determine the direction on any given stock price.

Bear ETFs short stocks to achieve their goals. Bear ETFs show gains when the underlying stocks loose value. Bull ETFs use long positions and show gains when the underlying stocks show gains.

A trailing stop loss is calculated in a manner like the way we calculated our initial stop loss. The only difference being that while we calculated our stop loss from the entry price, we’re calculating our trailing stop loss from the highest price since entry.

Had the American Indians sold their beads and trinkets they received from selling Manhattan Island, invested their $16 and received 8% compounded annual interest, not only would they have enough money to buy back all of Manhattan, they would still have several hundred million dollars left over. That is the power of compound interest over time.

Expirations determine when your order gets placed on the market.
Order Types offered in our Stock Market Game: Market Orders, Limit Orders, Stop Market Orders, Stop Limit Orders and Trailing Stop Orders

Penny stocks are stocks with a share price of $5 or less.

Definition: The amount of sales generated for every dollar’s worth of assets. It is calculated by dividing sales in dollars by assets in dollars. Formula: Asset Turnover = Revenue / Assets Also known as the Asset to Turnover Ratio. More Detail: Asset turnover measures a firm’s efficiency at using its assets in generating sales or revenue – the Read More…
Day traders buy and sell the same stock (or other investment type) within a single trading day.
A closed-end fund is a publicly traded investment company that raises a fixed amount of capital through an initial public offering (IPO). The fund is then structured, listed and traded like a stock on a stock exchange.

A tool that investors and traders can use to filter ETFs based on user-defined metrics. ETF screeners are offered on many websites and trading platforms, and they allow users to select trading instruments that fit a certain profile set of criteria.
A load mutual fund comes with a sales charge or commission.

An options strategy by which an investor retains a long position in an asset and writes or sells a call options on an identical in an effort to produce an increased income from the asset.

A revenue or expense stream that changes a cash account over a given period. Cash inflows usually arise from one of three activities – financing, operations or investing – although this also occurs as a result of donations or gifts in the case of personal finance. Cash outflows result from expenses or investments. This holds true for both business and personal finance.

Dollar Cost Averaging is the method of purchasing a fixed dollar amount of one particular investment at regular period of times, regardless of the share price.
Fundamental analysis is the process of looking at the basic or fundamental financial level of a business, especially sales, earnings, growth potential, assets, debt, management, products, and competition.

The first sale of stock by a private company to the public. IPOs are often issued by smaller, younger companies seeking the capital to expand, but can also be done by large privately owned companies looking to become publicly traded.
A Trading Halt is the temporary suspension of trading of a security for a specific period of time. Trading Halts typically last for an hour, but can extend into days.

Time Decay is the inclination for options to decrease in worth as the expiration date draws near. The extent of the time decay is inversely connected to the changeability of that option.