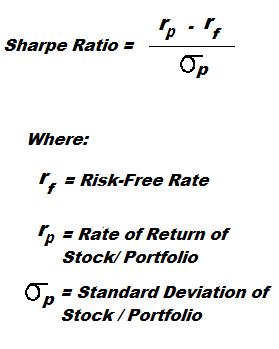
A Sharpe Ratio calculates the extra return you make compared to the extra risk you take on.

Capital Asset Pricing Model (CAPM) is a method used by investors to prioritize what stocks to invest in, given their limited cash.

Form 10-Q, is also known as a 10-Q or 10Q, is a quarterly report mandated by the United States federal Securities and Exchange Commission, to be filed by publicly traded corporations.

Companies with more than $10 million in assets and a class of equity securities that is held by more than 500 owners must file annual and other periodic reports, regardless of whether the securities are publicly or privately traded. Up until March 16, 2009, smaller companies could use Form 10-KSB. If a shareholder requests a company’s Form 10-K, the company must provide a copy. In addition, most large companies must disclose on Form 10-K whether the company makes its periodic and current reports available, free of charge, on its website. Form 10-K, as well as other SEC filings may be searched at the EDGAR database on the SEC’s website.

A financial ratio that shows how much a company pays out in dividends each year relative to its share price. In the absence of any capital gains, the dividend yield is the return on investment for a stock. The formula is Annual Dividends Per Share divided by Price Per Share.

A Call Option gives the holder the right, but not the need to purchase a fixed quantity of a particular stock at a specific price inside a particular time. Call Options are bought by investors who anticipate a price increase.

A measurement of the relationship between the price of a stock and the movement of the whole market. An asset has a beta of zero if it moves are not related to the benchmark’s moves. A positive beta means that the asset generally follows the benchmark, in the sense that the asset tends to move up when the benchmark moves up, and the asset tends to move down when the benchmark moves down. A negative beta means that the asset typically moves in the opposite direction as the benchmark: the asset tends to move up when the benchmark moves down, and the asset tends to move down when the benchmark moves up.

Technical Analysis is the use of technical indicators comprising of statistics using past market information to predict which direction the security price will move.
Current Ratio is the ratio of current assets divided by current liabilities. It provides A liquidity ratio that measures a company’s ability to pay short-term obligations. Also known as “liquidity ratio”, “cash asset ratio” and “cash ratio”.

Asset/Equity Ratio is the ratio of total assets divided by stockholders’ equity.

The Average True Range (ATR) is an indicator that measures volatility.
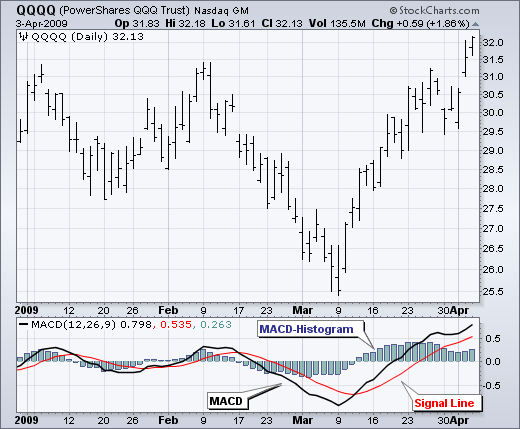
The Moving Average Convergence-Divergence (MACD) indicator is one of the easiest and most efficient momentum indicators you can get. It was developed by Gerald Appel in the late seventies.

Moving Averages Moving Averages are one of the most popular and important technical analysis tools. The ease of use and simple calculation make it a great tool to get information quickly. They also provide the basics for more advanced technical analysis tools like MACD and Bollinger Bands and can be useful for removing some of Read More…

Volatility is founded on the standard deviation, which modifies as volatility expands and declines. The bands spontaneously widen when volatility expands and narrow when volatility declines.
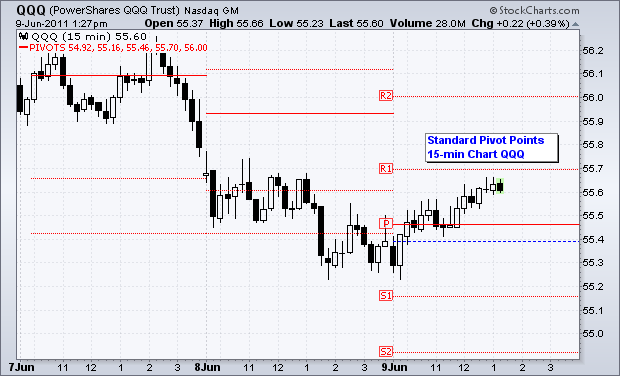
Pivot Points use the previous period’s high, low and close which will define future support and resistance. Pivots Points are important levels chartists utilize to decide directional movement, resistance and support

Quick Ratio is the ratio that measures the ability of a firm to cover its current liabilities with their most liquid current assets. Quick Ratio = (Current Assets – Inventory) / Current Liabilities

Delta is also called the hedge ratio, which is the ratio of the change in price of an option to the change in price of the underlying stock.

What are they doing with your money? Have you ever wondered how well your money is really being managed by the corporations you hand it over to? After all, the media is full of stories about CEO compensation reaching new heights, buy-outs of non-profitable holdings, million dollar birthday parties and other horror stories. Formula for Read More…

A Cash Flow Statement is a financial statement that shows the flow of cash in and out of the business. The Cash Flow Statement is particularly useful for investors and lenders to determine the short-term viability of a company with respect to its ability to pay its debts. In the statement, money coming in to Read More…

EPS (Earnings-Per-Share) measures how much of a company’s net income actually trickles down to each outstanding share. Any preferred dividends are first taken out of the net income before calculating EPS. Interpreting EPS Earnings Per Share can be used to compare the earnings of two or more companies in a similar industry. Just because one Read More…

PE Ratio (Price-to-Earnings) is a valuation ratio that compares the price per share of a company’s stock to its earnings per share. It basically shows how much investors are willing to pay for a share given the earnings currently generated. It is also used to analyze whether a stock is overvalued or undervalued. Formula How Read More…

A Sharpe Ratio calculates the extra return of an investment in return for the extra risk taken on. It is used to compare different investments to see which one did better given the different risk of each. It is measured as taking the difference between a risk-free and a risky asset, and then dividing the difference by the Standard Deviation (which Read More…

“Learning is not attained by chance; it must be sought for with ardor and attended to with diligence.” – Abigail Adams (1744-1818) Google (NASDAQ: ) You may have heard of technical analysis before or maybe you’re wondering what all the squiggly lines on ’s chart above represent. Those lines are a result of technical analysis. Technical analysis Read More…

Fundamental analysis is the process of looking at the basic or fundamental financial level of a business, especially: sales earnings growth potential assets debt management products competition This type of analysis examines key ratios of a business to determine its financial health and gives you an idea of the value its stock. Many investors use Read More…

Is Technical Analysis voodoo? Contrary to what some people think, Technical Analysis is not a kind of black magic or sorcery. Also, the use of technical analysis does not increase as we get closer to Halloween. It is important to keep an open mind and realize that things such as trend lines, triangles, and other Read More…