7-06 Trendlines
You’re probably aware that trendlines are important for your research on potential purchases or sales of securities. Base numbers are equally important to understand the true meaning of any trends you identify. Depending on the type of chart you’re viewing, you’ll want to establish a solid, unbroken trendline that graphically displays the direction a stock is heading.
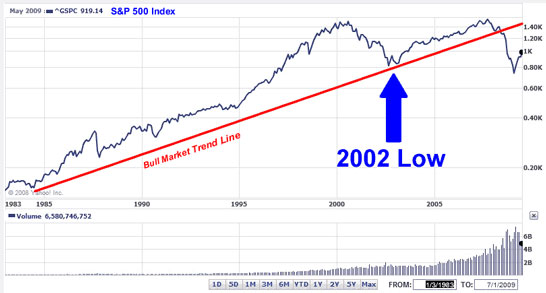
Notice the trendline in the chart above for the overall stock market was sloping upward from 1985 to 2007, indicating a bullish, or rising market.
Watch out for changes in a trendline. They might be subtle. However, if you plot the trendline carefully, you’ll see that your line may take a slightly different direction. In the above chart, do you see how the long-term upward sloping trendline was broken in 2008?
That tells you when the trend is changing, or has already changed.
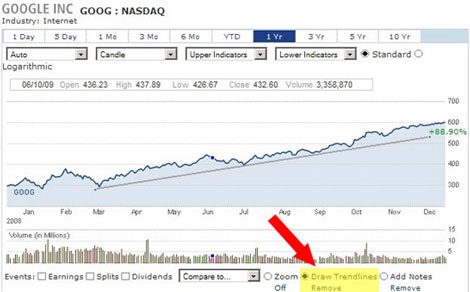
On most virtual accounts you can use the charts to draw your own trendlines by clicking the “Draw Trendlines” box at the bottom and then clicking on the chart to draw trendlines.
How to Draw a Trendline
Trendlines are drawn on stock charts by connecting price lows in an upward trend or price highs during a downward trend. You will need at least 2 to 3 points to draw the proper up or down trend. Make sure your trendline does not cut through the price candlesticks. If it does ignore this point.
For an upward trendline
- Find a key low within the chart
- From there look for 2-3 higher lows
- Connect them together.
- This will be your upward trendline.
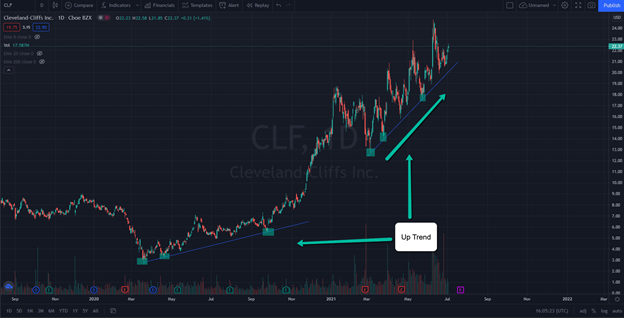
As you can see in the chart below for CLF, there are two trendlines showing the price is moving up and making higher highs.
For a downward trendline
Similar to the upward trendline, you will find a key low price and from there look for 2 to 3 lower highs. After connecting them together, you will have a downward trendline. In the chart below for SPWR, there are two red trendlines showing the price has been moving down from the middle of February 2021 to the beginning of July. There is a general trend where this stock’s highs are getting progressively lower.

Note: trendlines are subjective, but it’s important not to curve your lines so they fit what you want to see in the chart. If you’re not able to see a pattern, zoom out to get a better picture. By changing the scale of time, you may see where you can draw the trendlines.