7-05 Double Bottom
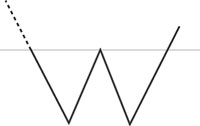
A Double Bottom chart will look like a “W.” It indicates that the stock hit a bottom market price, had a brief uptick, and then decreased again to turn a “V” shape into a “W.” The two reverse peaks should be around the same floor price and the time period should be similar to create the fairly well-formed “W.”
A Double Bottom is only complete when prices rise above the high end of the point that formed the second low. The two lows will be distinct. When prices rise above the highest high in the formation it is called the “confirmation point”.
Analysts vary in their specific definitions of a Double Bottom. According to some, after the first bottom is formed, a rally of at least 10% should follow. That increase is measured from high to low. This should be followed by a second bottom. The second bottom should return back to the previous low, (plus or minus 3%) at a lower volume than the first. Other analysts maintain that the rise registered between the two bottoms should be at least 20% and the lows should be spaced at least a month apart.
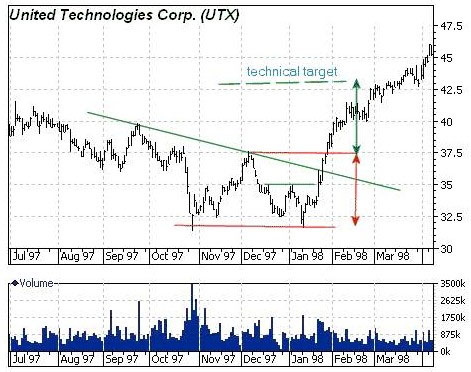
Look at the chart below that shows a very well defined double bottom and then the ensuing rise:
Double Top
Double Top is a chart formation that looks like an “M” shape. It indicates a market top and change of trend from bullish to bearish. This is an indication that the bulls are losing interest in the stock, and it has run its course.
The pattern starts with the stock moving in the direction of the new bullish trend. It should hit a new high, then will retrace back down to a prior support level, (reference the chart below for AOS). The stock will move back up to the prior high and attempt to break out of it. At this point you can see it failed to do so, why?
There were a lot of sellers at this point, and all the people who were holding the stock that missed the first uptake will attempt to sell back the stock once it reaches that prior high again. Once the sell off starts, the stock will move down and create the Double Top. Sometimes there is a Triple Top as we can see below.

To enter a trade using this chart formation you short the tops and take profit at the support level because there is a high probability this stock will go down and start a downward trend.
Double Bottom
Double Bottom is the opposite formation and looks like a “W” shape. It indicates that the market has found a bottom price and no more sellers are available to push it down further. In this pattern there should be a trend change from bearish to bullish.
The stock will move in the direction of the bearish trend and make lower lows then retrace back up to a prior resistance level (reference the chart below for DM). The stock resumes this trend and will try to move to the prior low to break out of it. At this point you can see it failed to do so, why?
Because there were a lot of short sellers who wanted to cover their position from before this point and a new wave of buyers will come in to buy this stock because they think it is at a good price. They are ready to go long now. Once the stock reaches that prior low the stock will move up and create the Double Bottom, and sometimes a Triple Bottom as we see in Desktop Metal stock.

To place a trade using the Double Bottom formation you buy the support and take profit at the resistance level because there is a high probability this stock will go up and start a new uptrend.