There is an infinite number of strategies that can be used with the aid of options that cannot be done with simply owning or shorting the stock. These strategies allow you select any number of pros and cons depending on your strategy. For example, if you think the price of the stock is not likely to move, with options you can tailor a strategy that can still give you profit if, for example the price does not move more than $1 for a month.
Option Pricing
Option pricing is typically done using the black-scholes model which can be quite complex. The main thing to understand is that american-style options have intrinsic value because of the fact that they expire in the future. The option’s price will therefore reflect the immediate profit you could make (if any) by exercising this option and the time value.
For example, an out-of-the money (you would not exercise this option because you would lose more money) put would still have a price above 0 as long as it is not expired because there is always a chance that the option may become in-the-money (by exercising this option you would gain money, note:this does not mean, however, that you are making a profit. You can be in the money but still losing money because the option price is greater than the profit you make from exercising the option).
Option Payoff diagrams
Option Payoff Charts and tables are very useful for visualizing and understanding how options work. In these scenarios you have already purchased or “written”(writing an option means you have sold the option to someone who has bought it) the option. The stock price is a “what if the stock price goes to that price”.
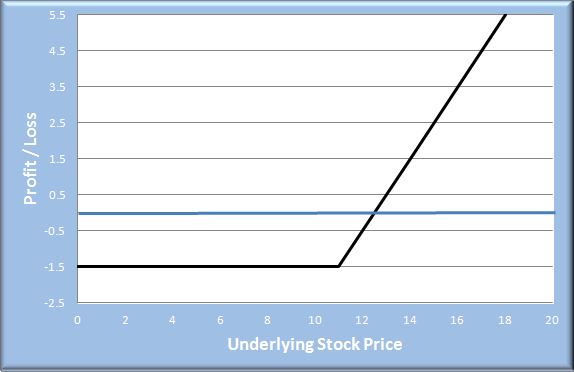
Example 1: Bought Call Option with a $9 Strike Price and an option price of $1.5 for 1 share in the contract (normally this is 100 shares per contract) and a current price of $10
| STOCK PRICE | STOCK – STRIKE PRICE | OPTION PROFIT/LOSS | COMMENT |
|---|---|---|---|
| 0 | -11 | -1.5 | In this case, the option is out of the money and you would not exercise it, hence the most you can lose is the price you paid. |
| 10 | -1 | -1.5 | |
| 11 | 0 | -1 | This point is called “at the money” |
| 11.5 | 0.5 | -1 | You are now in the money but still losing money |
| 12 | 1 | -0.5 | |
| 12.5 | 1.5 | 0 | Break-Even point. By exercising your option you will break even (0$ profit or loss) |
| 14 | 3 | 1.5 | You are now making a profit |
| 18 | 7 | 5.5 | To calculate your profit you would do Stock Price – Strike Price – Option Price |
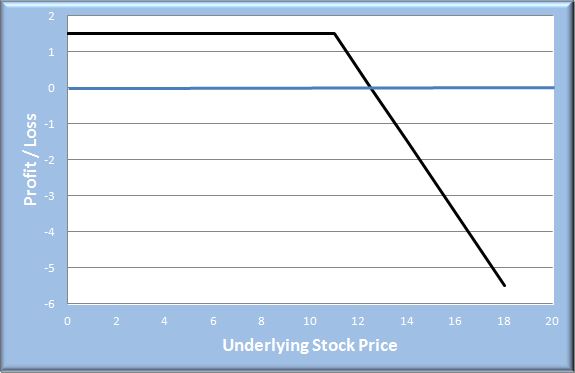
Example 2: Writing a Call Option with a $9 Strike Price and an option price of $1.5 for 1 share in the contract (normally this is 100 shares per contract) and a current price of $10.
| STOCK PRICE | STRIKE PRICE – STOCK | OPTION PROFIT/LOSS | COMMENT |
|---|---|---|---|
| 0 | 11 | 1.5 | As long as the option is out of the money, the owner would not exercise it, hence you make the option price. |
| 10 | 1 | 1.5 | |
| 11 | 0 | 1.5 | This point is called “at the money” |
| 11.5 | -0.5 | 1 | The owner will now start exercising it and you will be covering the price between the strike price and stock price. You still make a dollar |
| 12 | -1 | 0.5 | |
| 12.5 | -1.5 | 0 | Break-Even point. By exercising your option you will break even (0$ profit or loss) |
| 14 | -3 | -1.5 | |
| 18 | -7 | -5.5 | To calculate your profit you would do Strike Price – Stock Price + Option Price |
As we can see above, when buying a call our loss is limited to the option’s price but when we write an option our losses are potentially infinite. With contracts of 100 shares each you can see how quickly you can lose very large sums by writing options.
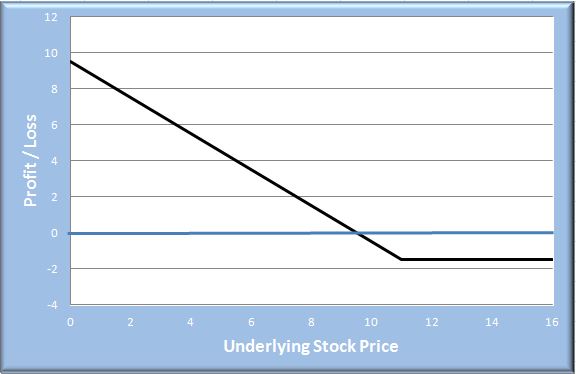
Example 3: Bought put Option with a $11 Strike Price and an option price of $1.5 for 1 share in the contract (normally this is 100 shares per contract) and a current price of $10.
| STOCK PRICE | STRIKE PRICE – STOCK PRICE | OPTION PROFIT/LOSS | COMMENT |
|---|---|---|---|
| 0 | 11 | 9.5 | In this case you are making the most money you could You would calculate with Strike Price – Stock Price – Option Price |
| 6 | 5 | 3.5 | |
| 9.5 | 1.5 | 0 | Break even point |
| 10 | 1 | -0.5 | The option is in the money but you still have a loss. |
| 11 | 0 | -1.5 | The option is out of the money and the most you can lose is the option price |
| 16 | -5 | -1.5 |
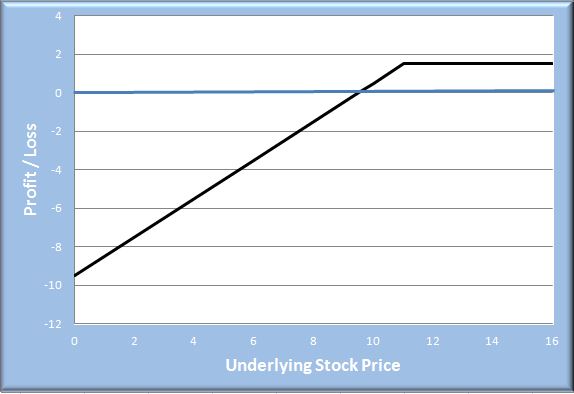
Example 4: Write a Put Option with a $11 Strike Price and an option price of $1.5 for 1 share in the contract (normally this is 100 shares per contract) and a current price of $10
| STOCK PRICE | STOCK PRICE – STRIKE PRICE | OPTION PROFIT/LOSS | COMMENT |
|---|---|---|---|
| 0 | -11 | -9.5 | In this case you are losing the most money you could You would calculate with Stock Price – Strike Price + Option Price |
| 6 | -5 | -3.5 | |
| 8.5 | -2.5 | -1.0 | The option is in the money still. |
| 9.5 | -1.5 | 0 | Break even point |
| 10.5 | 0 | 1 | Here the option is still in the money but are making a profit. |
| 13 | 2 | 1.5 | The option is out of the money and the most you can earn is the option price |
| 16 | 5 | 1.5 |
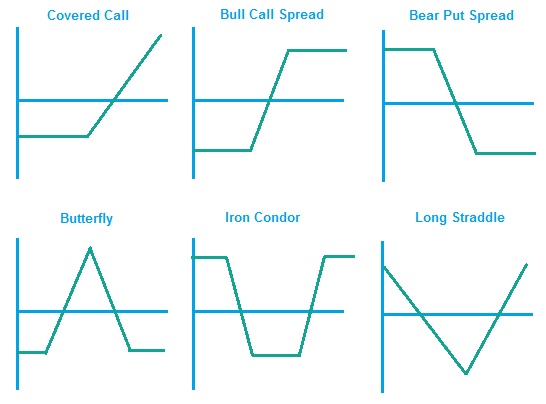
Below we can see just a few common strategies that can be accomplished by using a different combination of owning and shorting (selling) the option or stock, using a call or a put and varying the stock price. You can also create even more in depth strategies by varying the expiration dates of your options.
