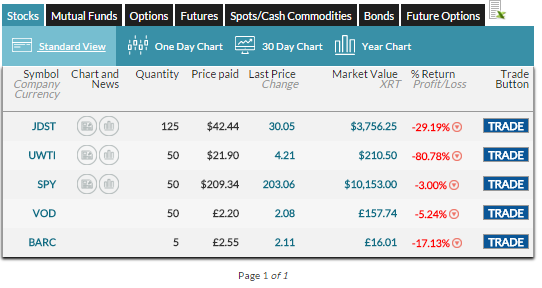
You can find your Open Positions page in two places: your [link name=”dash” dest=”/account/dashboard”]Dashboard[/link], or your [link name=”open” dest=”/portfolio/openpositions”]Open Positions[/link] page.

The only difference between the two pages is that the “Dashboard” version will have all the security types as tabs you can switch between, while the “Open Positions” page will show each type separately.
All prices on the Open Positions page are delayed by 15 minutes (but trade at real-time prices).
Views
You can view your portfolio either as a list of your securities (10 will show per page, if you have more you can switch pages), or as a series of charts
List View

The list view is the default. The special feature of this view is that the prices for US equities will update every few seconds, so you can see how your portfolio is evolving.
Chart View

You can switch between daily, monthly, or yearly performance charts for your holdings. Note that not every security type supports charts, and not every security will have a chart available.
The charts will show the performance of that security, color coded. Green means you’re making money, red means you’re losing money.
Features
Besides updating prices and charts, there are some other handy features available on the Open Positions page:
- Export to Excel – you can export your open positions by clicking the small excel icon in the top right

- Get a detailed quote – if you click the symbol on the “List” page, you will get a detailed quote, along with current charts and news, for that stock
- Charts and news – There are also small buttons that will take you direct to the chart or news page for that symbol
- More data than meets the eye – if you hover over some of the numbers, we’ll give you even more information:
- Hover over the symbol to see the full company name, and the currency this stock is denominated in
- Hover over the “Last Price” to see how much the price has changed today
- Hover over Market Value to see how much it is worth in your local currency (useful if you buy international stocks)
- Hover over your % return to get the total amount of money you’ve made or lost on this position
- The trade button will take you to the trading page for this security, pre-populated to “close out” your position (so if you own 10 shares of Sprint stock, this button will take you to the trading page, set to Sell 10 shares of Sprint stock)