
What Is TD Bank’s Virtual Stock Market Simulation?
It is a portfolio simulation tool for students to get familiar with real market data, buying and selling securities, and managing a portfolio in a controlled environment.
Teachers or Instructors can set up a class by defining the “class rules” – what types of securities can be traded (stocks, options, mutual funds, etc.), how much starting cash is given, and much more. Students then join the class by creating their own unique username and password and can begin building their investment portfolio.
This platform uses all real market data, meaning the portfolio students manage is just like managing their own brokerage account. Students can see their portfolio returns, as well as view a class ranking showing their performance relative to the rest of the class. This gives an immersive feel for what it is like to manage a real portfolio – real market data, real price movement, real investment strategy, but with virtual money.
Creating Your Account
There are two ways to set up your account.
Direct Link
First, your teacher may send you a direct link, which will take you to the Registration Page with the class information loaded. You will be asked to confirm your age first.
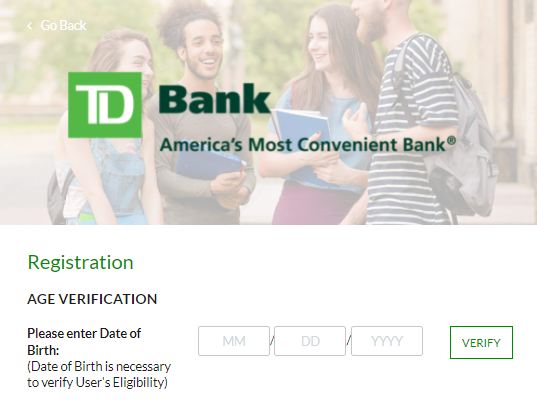
From here, simply create a login by entering your username and password. Make sure your email is correct so that if you ever forget your password, you can use the “forgot password” link to create a new one.
Without Direct Link
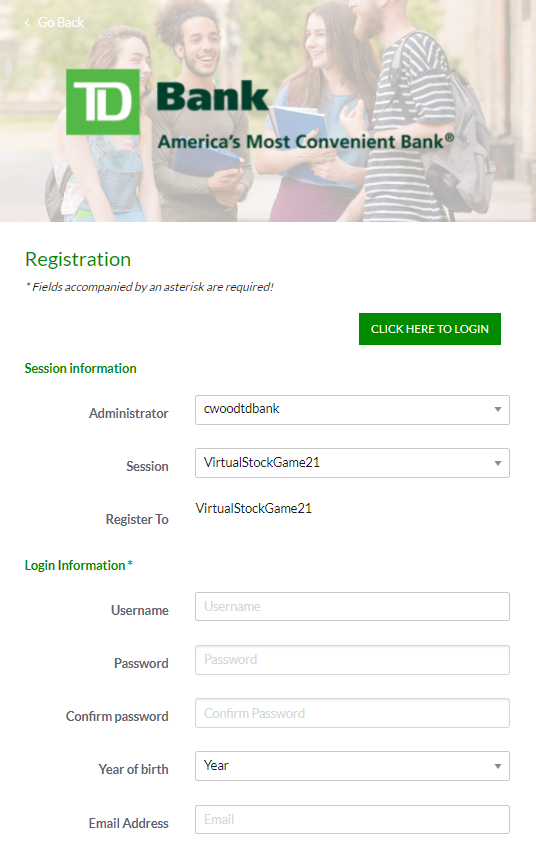
If you do not have a direct link, visit the homepage and click “Register Now”. You will be taken to the same date of birth confirmation page. Once through this step, you can select any of the public challenges available after selecting the administration. You are always welcome to join the WOW!Zone Challenge!
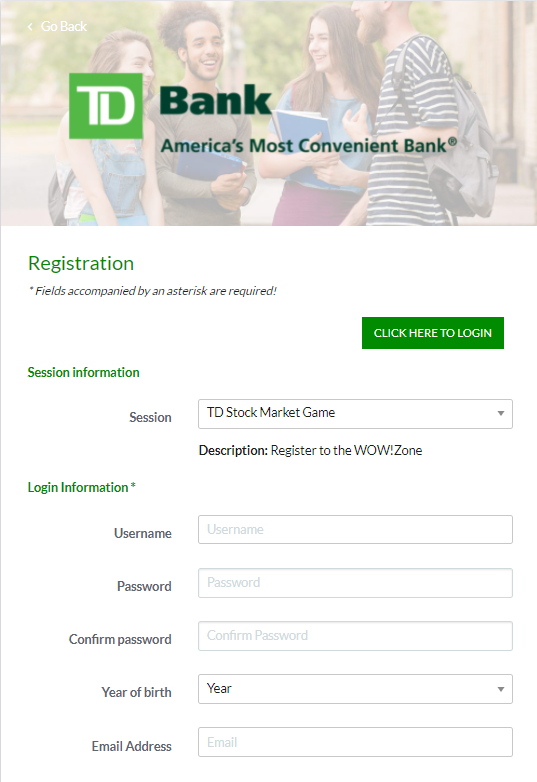
Once you create your account, you will be automatically logged in and ready to start managing your portfolio.
Changing Your Password Or Email Address
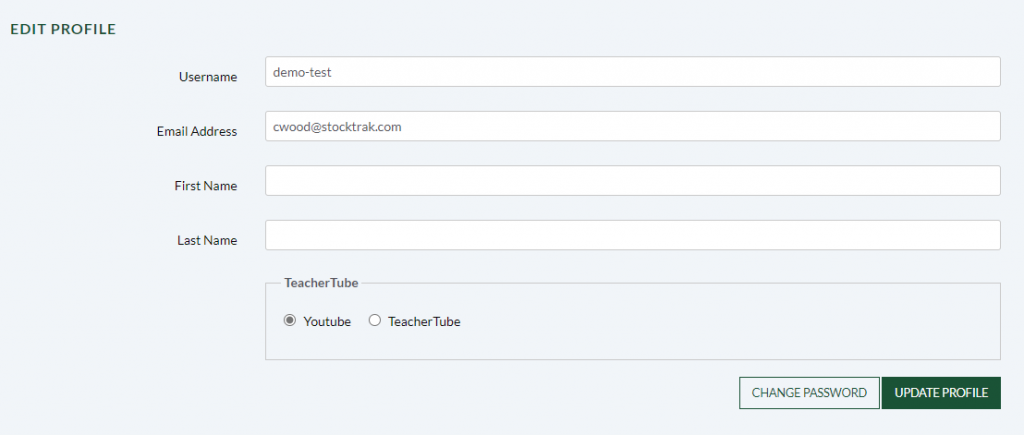
After registering, you may need to change your password or email address. You can do this by going under “Dashboard” on the main menu and clicking “My Profile”. Once on that page you can change you email, username and password.
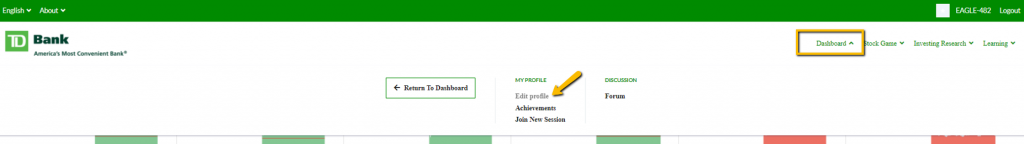
You should see the following page after clicking My Profile from the dropdown menu. If you ever need assistance with your account, please send in a ticket to our support team on this page Contact Us .
Getting Started
If you are new to investing, there are a lot of new terms to learn. But do not worry, this guide will provide you all the information to get started. Below we outline how to navigate our dashboard, how to place a trade, and manage your holdings.
Your Dashboard
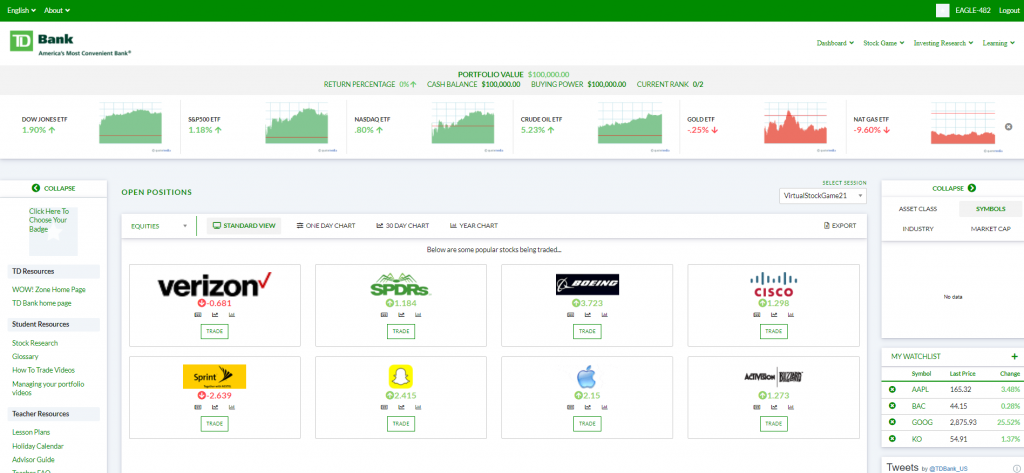
When you first log in, you will be taken to your Dashboard. At a glance, this page has a lot of useful information for your portfolio. You can get back to this page at any time by clicking “Dashboard” on the main menu.
Parts of the page:
- Under the main menu, you will see a snapshot of your portfolio. It has your current portfolio value, percentage return, cash balance, available buying power and current rank.
- Below that a “Market Snapshot” showcases charts of the current market performance for the day. You can close this at any time by clicking the “X” on the right side.
- Next, you can see your open positions, including the market value, price purchased, the current profit/lost with the ability to chart your holdings. If you don’t have any stocks yet, there will be a list of ideas. You can click “Trade” to buy some shares in one of them.
- On the right side panel, you’ll see a breakdown of what is in your portfolio with a pie chart. You can toggle through asset class, symbols (and the percentage of your portfolio it comprises), industry and market cap. The pie chart will update based on your current holdings.
- “My Watchlist” is used to monitor stocks that you’re interested in buying. You can add more by clicking the plus “+” button.
- Below your watchlist, you can keep up to date on TD Bank news from what is shared on the Twitter page.
- On the left side panel, there are many useful links that take you to TD specific resources, and right below some useful links for students.
Account Balances
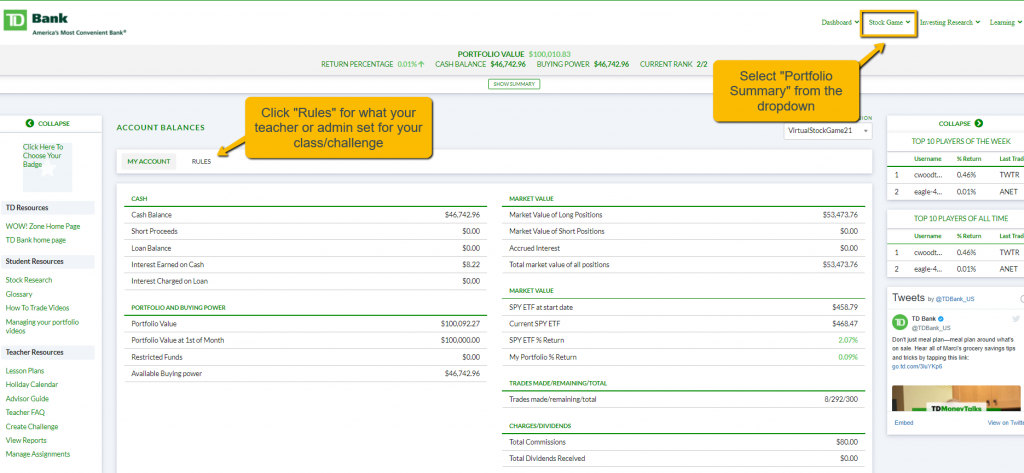
You can find your detailed account balances from “Portfolio Summary” under the Stock Game menu. You will be able to check your class rules by clicking the button “Rules”. Your instructor sets your currency, starting cash, interest rates, commission charges, trading dates, and a few more rules:
- Position Limit: This is how much of your portfolio you can invest in one single stock. For example, with a 25% position limit, you can invest up to 25% of your portfolio in Google stock, but not more.
- Day Trading: This allows you to buy and sell the same stock in the same day. If this is not allowed, you must wait until the next day to sell any stocks you buy.
- Allow trading on margin: This allows you to borrow money. This happens automatically – if you use up all your cash, you will automatically start borrowing more, up to your margin limit (meaning when your “buying power” is zero). You will be charged interest on your loans.
Buying Your First Stock
To buy your first stock, click on Stocks from under “Make a Trade” column on the Stock Game dropdown menu.
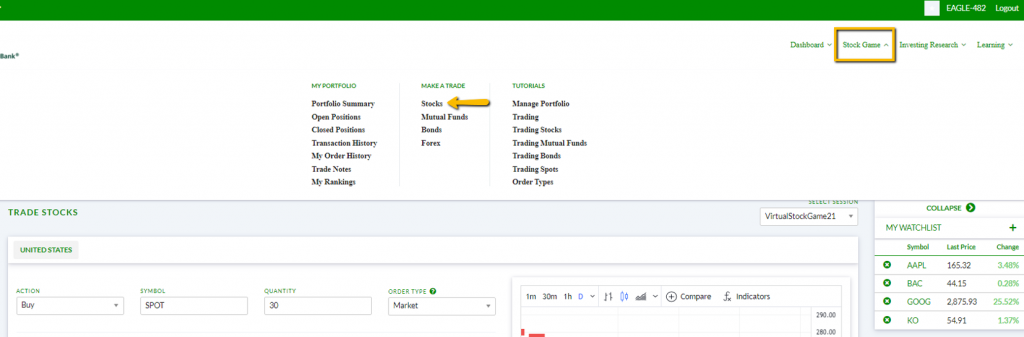
Note: There is also a video tutorial available showing how to buy and sell stocks. You can find these by clicking “How To Trade Videos”, which is also under Trading on the main menu.
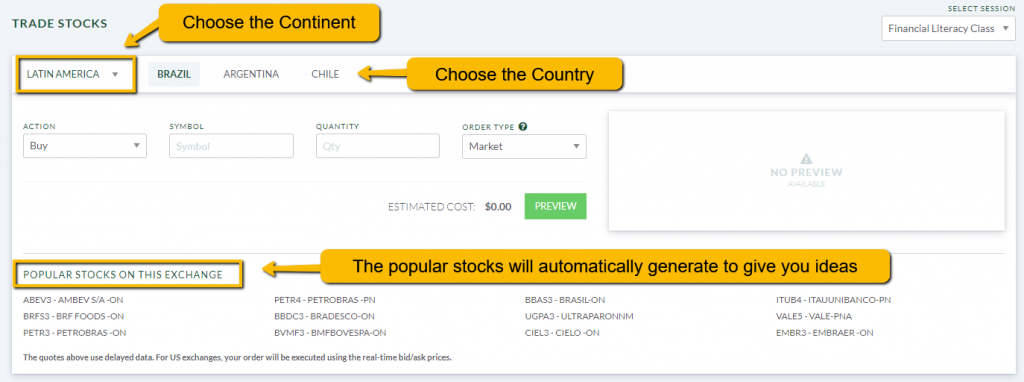
Once you are on the trading page, enter the ticker symbol of the company you wish to buy. If you do not know the ticker symbol, just try typing the company name, and we will show a list of ticker symbols that match.
Once you enter a symbol, some quote information will load, including the company name, logo, last price, bid/ask price, a chart showing its performance for the last trading day, and an analyst rating showing what current investment experts are saying about this stock.
Some notes to keep in mind:
- You do not buy or sell stocks at the last price. Just like the real world, the price you pay is determined by the bid and ask prices.
- Bid price: This is the highest amount a “buyer” in the market is willing to pay. If you want to sell a stock, you will receive the “bid” price.
- Ask price: This is the lowest amount a “seller” in the market is willing to take for their stock. If you want to buy a stock, you will pay the “bid” price.
- To buy or sell a stock at the current bid/ask prices, you will use a “Market” order type. You can also use “Limit”, “Stop”, and “Trailing Stop” order types. To learn more about these order types, please watch the video tutorials.
Once the quote information has loaded, enter the number of shares you wish to buy to load the “Estimated Order Total”.
The estimation does not include commission costs. Next, click “Preview”. This will load a more detailed estimation, with the commission cost included.
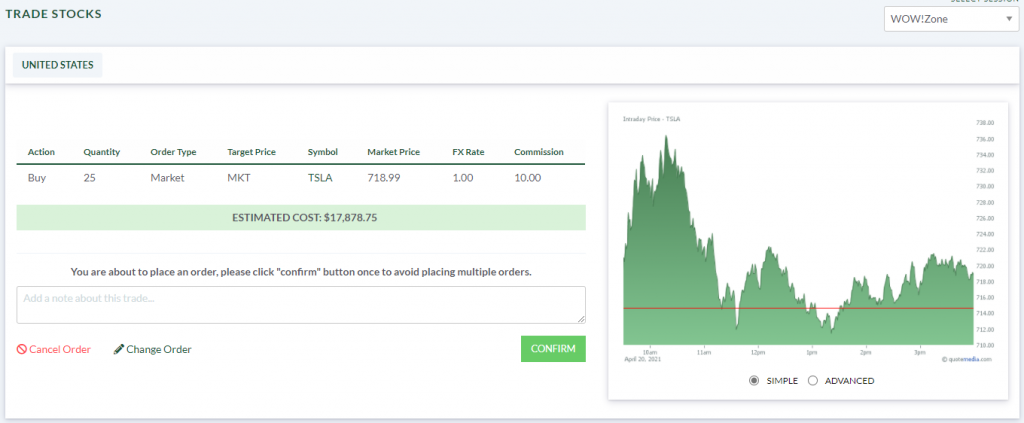
Click “Confirm” at the bottom of the page to send your order. The system will hold your order, and it will execute if the following conditions are met:
- The markets are open. If you are trying to trade outside of market hours, your order will be “pending” until the markets are open, then it will execute at the opening prices.
- If you are using a limit/stop order, your limit or stop conditions are met.
- You are trying to buy fewer shares than have actually traded in the market today (you can’t be a “market maker”, you can only buy stocks that are trading in the real world).
Viewing Your Holdings
Once you have one or more stocks in your portfolio, you can see them from your “Open Positions” page. This is under “My Portfolio” on the main menu. This will load a table showing your current holdings:
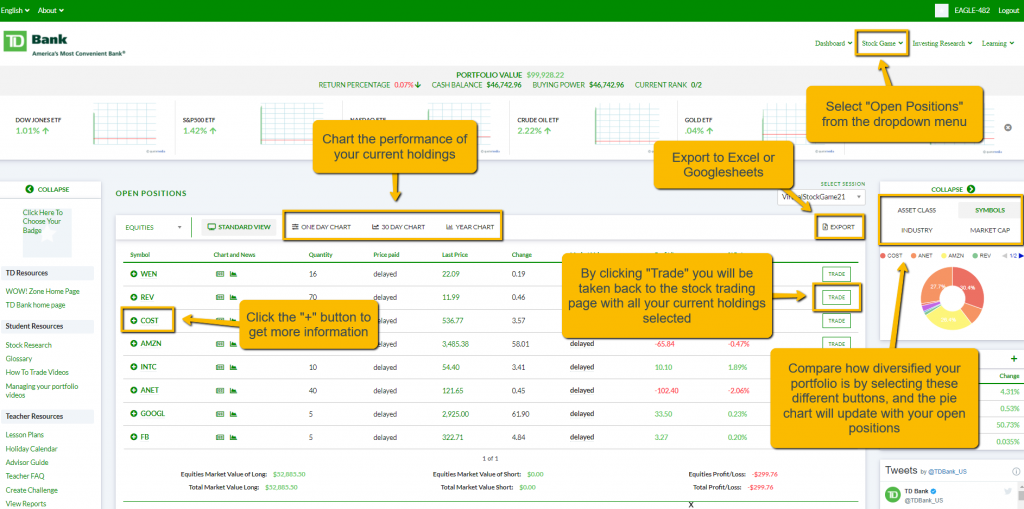
Items in this table:
- Action Button – Trade: This will take you back to the trade page to “close” this position, meaning sell off all your shares at the current market price. You still have a chance to preview or edit your order after clicking this.
- Symbol: This is the ticker symbol of this holding
- Round Buttons: These will open detailed quote and news information for each holding to see more information about it.
- Description: For stocks, this is the full company name
- Quantity: The number of shares you own. If you are “Short selling” a stock, this number will be negative.
- Currency: If you are trading international stocks, this currency will show what currency this stock is valued in
- Price Paid: This is how much you paid when you bought the stock
- Day’s Change: This is how much the price has moved so far today for this stock
- Profit/Loss: This is how much you have made or lost on this holding, denominated in your portfolio currency
- Mkt Value: This is the current market value of your holding in your portfolio currency
- %: This shows your percentage gain or loss for each holding.
Note: the “Last Price” and “Day’s Change” will update every few seconds for US stocks while the markets are open.
Chart Views
In addition to this “List View”, you can also view your portfolio as performance charts for each holding, using daily, monthly, or yearly charts. To do this, click the toggles above the portfolio table:
This will load the respective “Chart Views”:
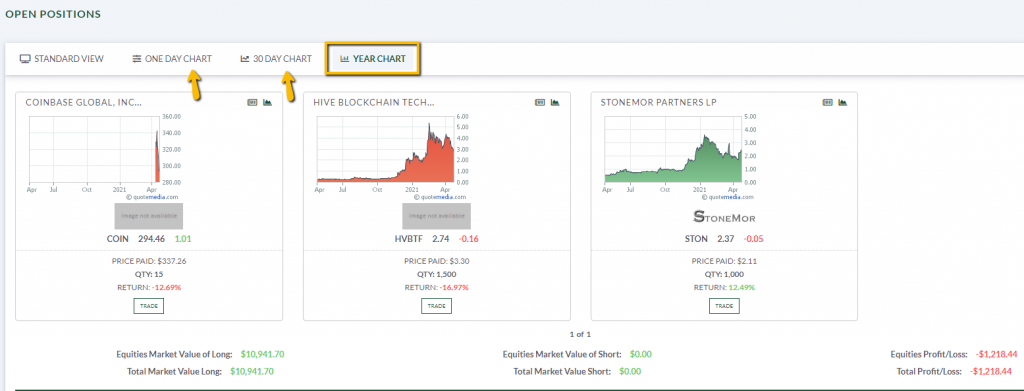
The chart view has almost all the same information as the list view. The charts are color-coded: red if you currently have a negative return for that holding, green if you currently have a positive return. The chart view can be a fast and efficient way to visualize where you are making and losing money in your portfolio.
Class Rankings and Portfolio Performance
Now that you have some stock in your portfolio, you can check to see how your portfolio is performing relative to the rest of your class, and over time.
Class Rankings
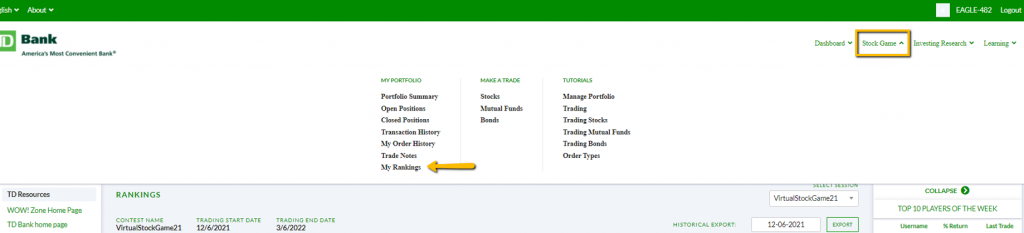
To access the challenge or class rankings, click on “My Rankings” from under the Stock Game button on the main menu.
This page will show each participant’s name, username, market value, current portfolio value, and total number of trades made, with their overall percentage return (and chart to show relative performance):
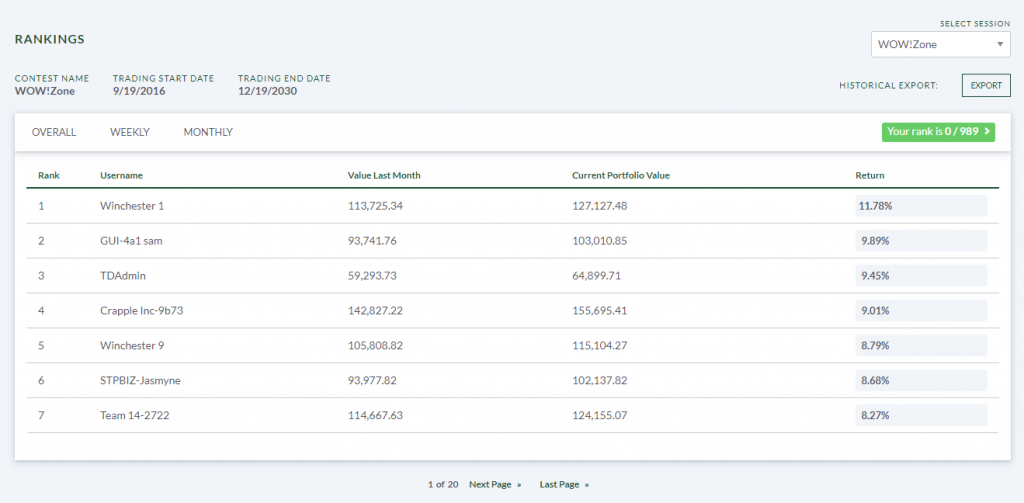
You can also use the date switcher above the chart to view the rankings on any day in the past.
Trading History and Order History
If you want to see the trades you’ve placed in the past, click “Transaction History” under “Stock Game” on the main menu:
This will show every trade you’ve placed, but it will not show orders that did not execute (such as pending orders and limit orders). You can also specify the date range of trades you want to see and export the table to Excel. You will also have a button to “Trade Again”, which will bring you back to the Trading page loaded to buy or sell that same stock again.
If you also want to see pending orders, or orders that were cancelled, you can go to the “My Order History” page, which is also under “Stock Game” on the main menu:
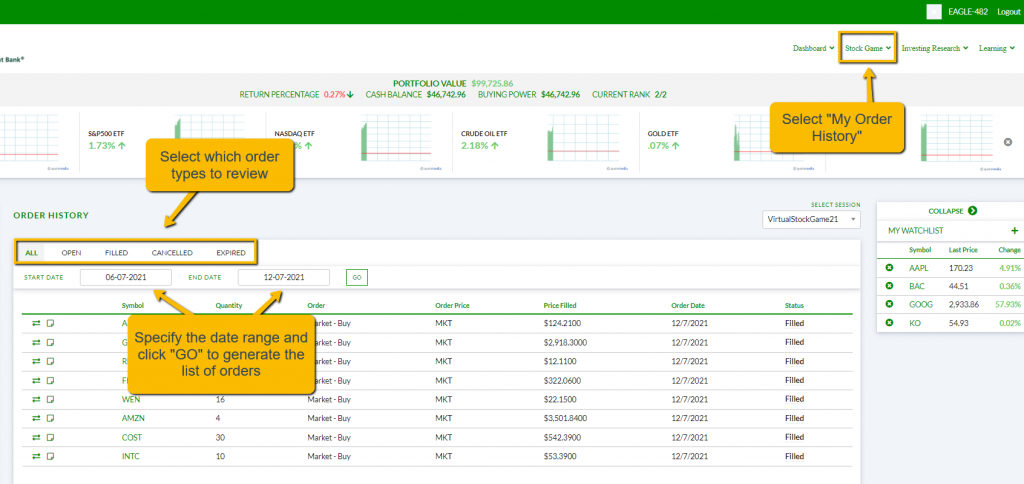
Your order history page will have more information on each order, and you can filter by type:
- Order Date: This is the day when you originally placed the order. For pending orders, there is a “cancel” button below the date, which will cancel the order.
- Order Type: This tells whether this was a market, limit, or stop order, along with if it was a buy, sell, short, or cover.
- Symbol: the stock symbol for this order
- Quantity: the amount of shares you wanted to trade
- Order Price: If you used a limit or stop order, this will have your limit or stop price. For market orders, it will simply say “MKT”.
- Trade Price: This is the price at which your order filled (this is what is shown on the Transaction History page).
- Type: The security type you attempted to trade, (equity, mutual fund etc.)
- Currency: The currency of the security you attempted to trade
- Order: This is the order number, which is unique to every order placed on the system and can be used by the support team if you suspect there is a problem.
- Status: This is the current status of the order:
- Filled – This order executed as a trade
- Open – This order is pending for all of its execution conditions to be met, you can cancel it if you wish
- Expired – The order expired before its conditions to fill were met. You can change your order expiration on the trading page, by default it is 1 day.
- System Cancelled – The system cancelled your order automatically. This is either done by our support team to address an issue, or due to a corporate action of some kind (like a stock split, or the symbol being de-listed from the stock exchange).
Research Tools
You can find all of the research tools under the Investing Research button from the main menu.
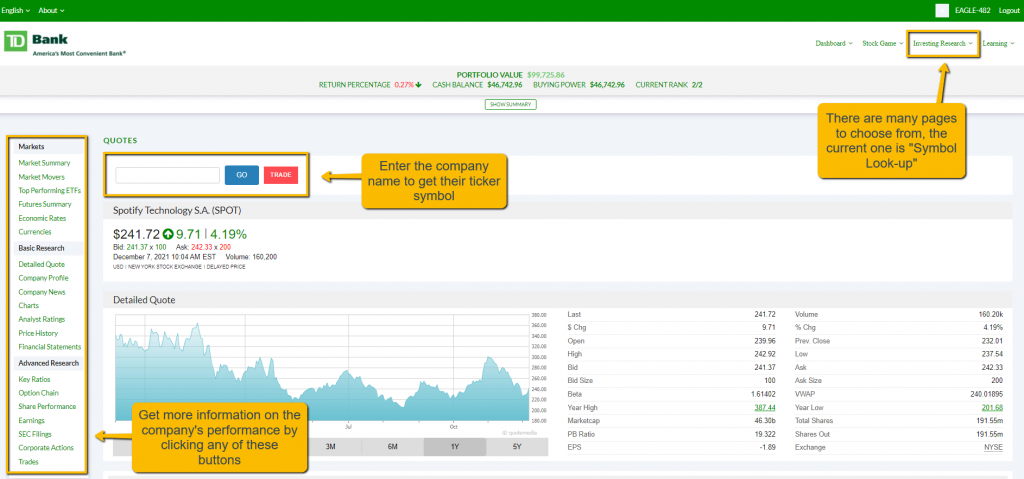
- Quotes/Research: This is the main research tool. You can enter any company symbol to load a detailed quote, charts, and all current news stories featuring this company. You can also see information on their option chains, income statements/balance sheets/cash flow statements, and all of the information in the items below. You can also find information about futures and commodities on this page.
- Symbol Lookup: If you are not sure what the symbol is of a company you want to trade, you can use this tool to look up their stock symbol.
- Company News: This lists all current news stories mentioning a company you wish to research.
- Key Ratios: This includes information like revenue per share, revenue growth over the last several years, gross and adjusted margins, current ratio, total debt to equity ratios, and much more.
- Share Performance: Includes some information on peak/trough stock prices over the last year, earnings per share, 10, 221, 50, 100, and 200 day moving averages, alpha, beta, R-Squared, standard deviation, and much more.
- Earnings: Includes very detailed reports on company earnings, estimates, and deviations
- Filings: Includes all SEC filings for all US companies, exportable by PDF, Word, or Excel.
- Trades: A detailed order book for this stock.
- Price History: Historical prices for this company’s stock, exportable to Excel.
- Analyst Ratings: What current financial experts are saying about this stock.
- Company Profile: Some information about what this company is, what they do, and their current management.
- Corporate Events: Mentions the biggest events that caused a shock in the company’s price, such as earnings announcements, dividend and split dates, earnings surprises, and more.
- Charts: Interactive comparative charts where you can compare numerous stocks simultaneously based on several technical analysis indicators
- Market Summary: This is a general overview of the market as a whole (both North American and international).
More Help
If you need more help getting started, or have any other questions while managing your portfolio, there are three places to look.
Tutorial Video Center
You can find our tutorial videos explaining how to manage your portfolio, trade each security type, use different order types, and much more by going to our “How To Trade Videos” page, which is under “Tutorial Videos” on the main menu.
Student FAQ
You can find the answers to some of the most common questions in our “Student FAQ” page, which can be found under “About” in the top menu.
Contacting Support
If you have other questions or other issues not covered in the video guides or FAQs, use the “Contact Us” form at the bottom of the “About” dropdown menu from the top menu to get in touch with our support team. We respond to all issues within 1 business day.