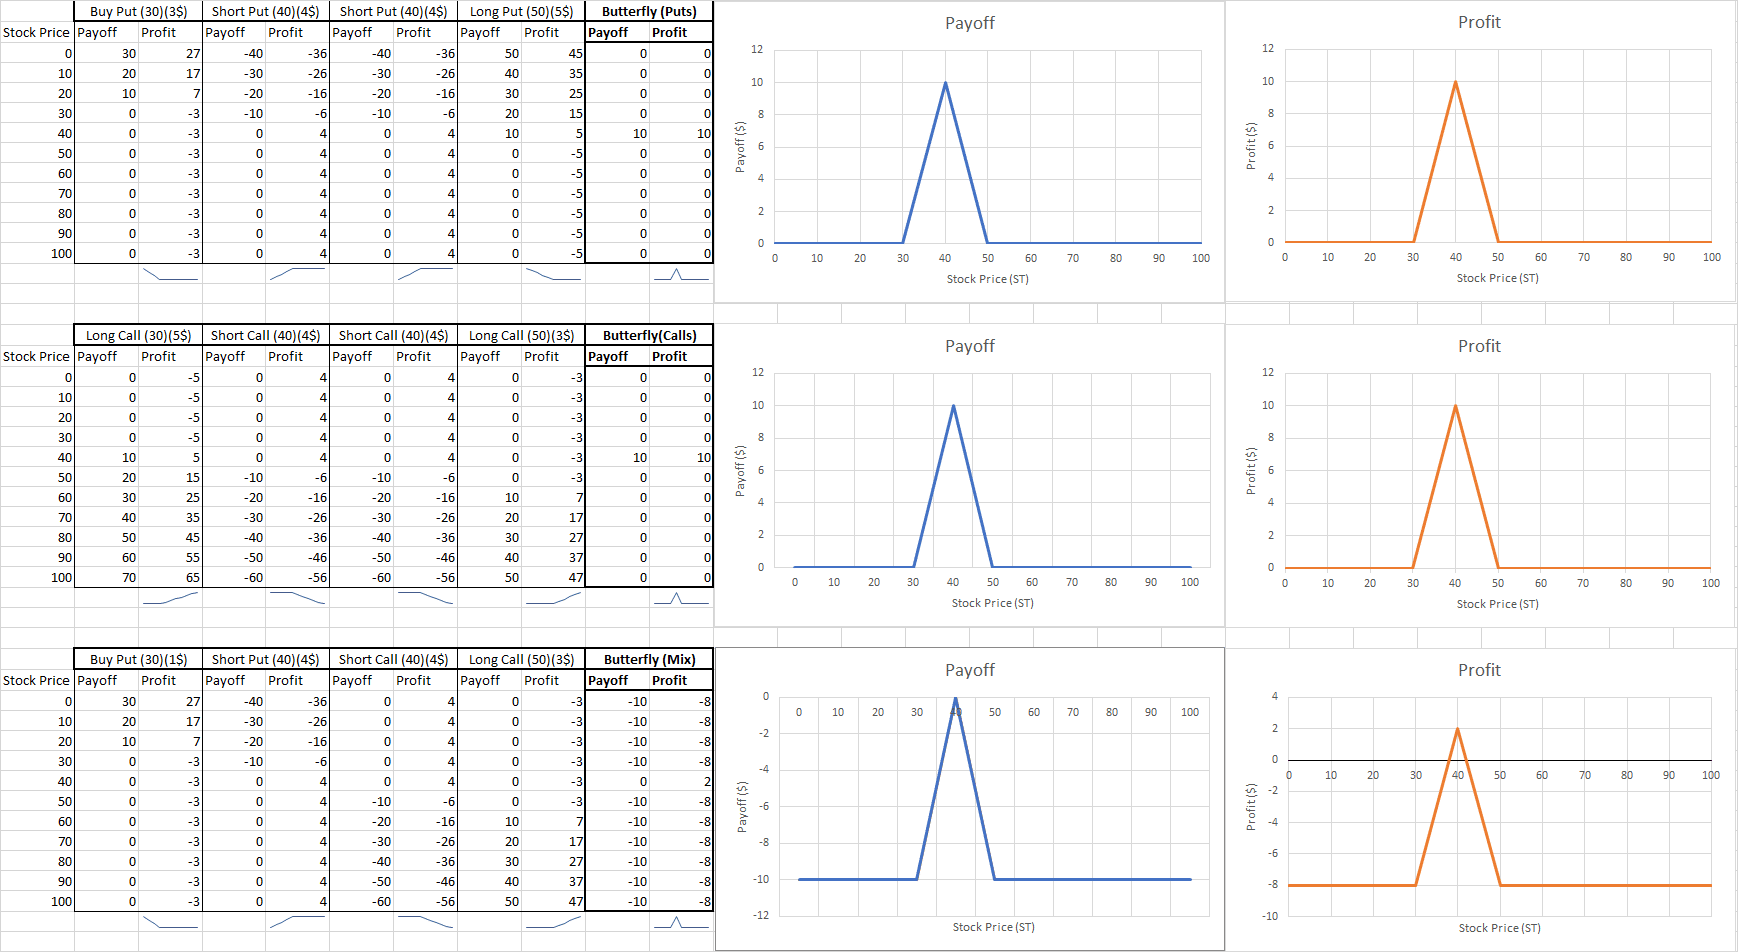
A butterfly is a volatility bet that the trader can implement to protect against large fluctuations, or to gain on volatility. You will notice that a butterfly is almost like a straddle, with a difference in the edges. The traders can add additional contracts to his/her strategy to reduce the risk of large losses or gains for more protection. A butterfly can be executed in different ways: with puts only, calls only, or a mix of both.
What are its components?
A long butterfly can be created in three ways:
- Butterfly with puts only
- Buy Put at strike price 1
- 2 x Sell Put at strike price 2
- Buy Put at strike price 3
- Butterfly with calls only
- Buy Call at strike price 1
- 2 x Sell Call at the strike price 2
- Buy Call at strike price 3
- Butterfly with puts and calls
- Buy Put at strike price 1
- Sell Put at strike price 2
- Sell Call at strike price 2
- Buy Call at strike price 3
- (*A short butterfly can be created by implementing the reverse strategies above)
When and why should I have a butterfly?
You should have a butterfly if you expect to see a lot of fluctuation in the underlying asset’s price. Creating a butterfly does not infer that you have a specific view on the stock. It simply implies that the trader expects a lot of volatility and executed a strategy to gain something from it. You can create a short butterfly if you do not expect any fluctuations.
What does it look like graphically? What is the payoff and profit graph?

What is the break-even point?
The break-even point of a butterfly can be defined by finding the stock price where the butterfly generates a zero-dollar profit. By adding all contracts and equating it to zero, you should solve for ST. However, there is a possibility where a region of stock prices can break-even. To find this region, you should create scenarios to define the payoffs. For example, the payoff when ST<30, 30<ST<40, 40<ST<50 and 50<ST.