Basic Research and Comparing Stocks
When you first set out to build a portfolio, it can be overwhelming to choose your first stock!
In this activity, we will walk through conducting some basic research on a company you find interesting, and learn how to compare it against another company in the same sector to determine which would be a better choice to add to your portfolio for your first trades.
Basic Research and Comparing Stocks
When you first set out to build a portfolio, it can be overwhelming to choose your first stock.
In this activity, we will walk through conducting some basic research on a company you find interesting, and learn how to compare it against another company in the same sector to determine which would be a better choice to add to your portfolio for your first trades.
ContinueBasic Research and Comparing Stocks – Continued
To make your first comparison, we will use a technique called “Buy What You Know”.
What companies do you use every day, or do you think have a good reputation? Pick one of these – and we will use tools to compare it against some of its competitors to determine which might make a better addition to your portfolio.
ContinueBasic Research and Comparing Stocks – Continued
When you have the name of a company in mind, we will use the “Symbol Lookup” tool to find that company’s ticker symbol. This is found under “Investing Research” on the main menu.
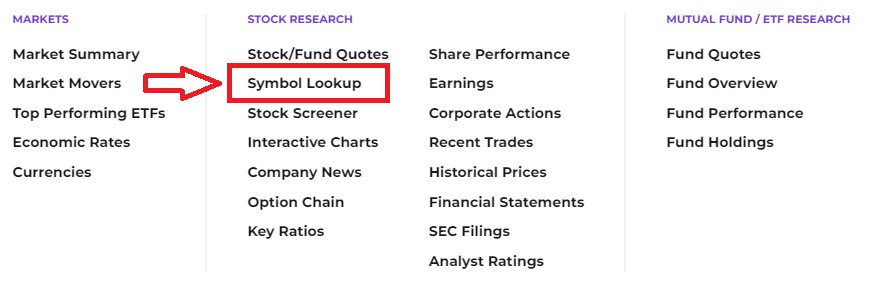
If you cannot find the company’s stock, it may be that it is not available to trade. Some companies (like Nintendo) only trade in foreign markets (in this case, Japan), making it harder to find its stock. Others (like Ben & Jerry’s Ice Cream) are owned by larger conglomerates (in this case, Unilever, ticker symbol UL), so you may need to do some research to find the parent company.
Once you find a ticker symbol of a company you want to start with, enter it in the field on this page to continue.
ContinuePrice
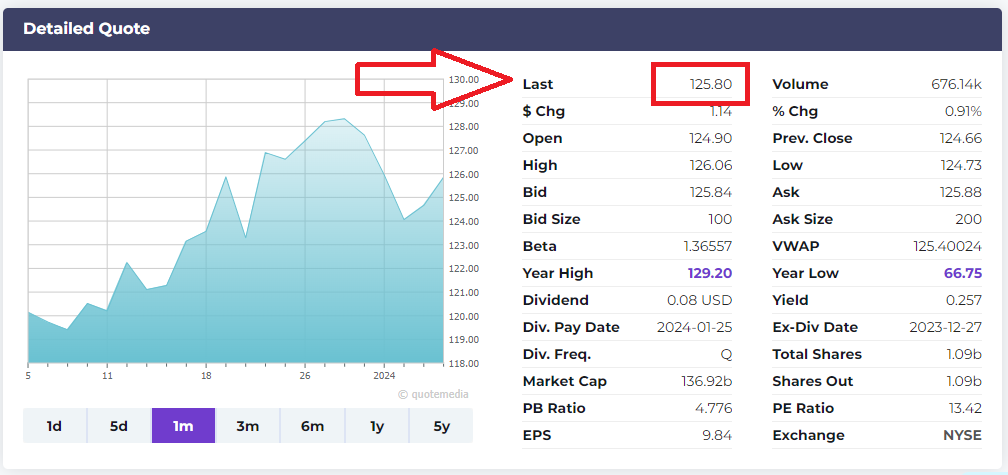
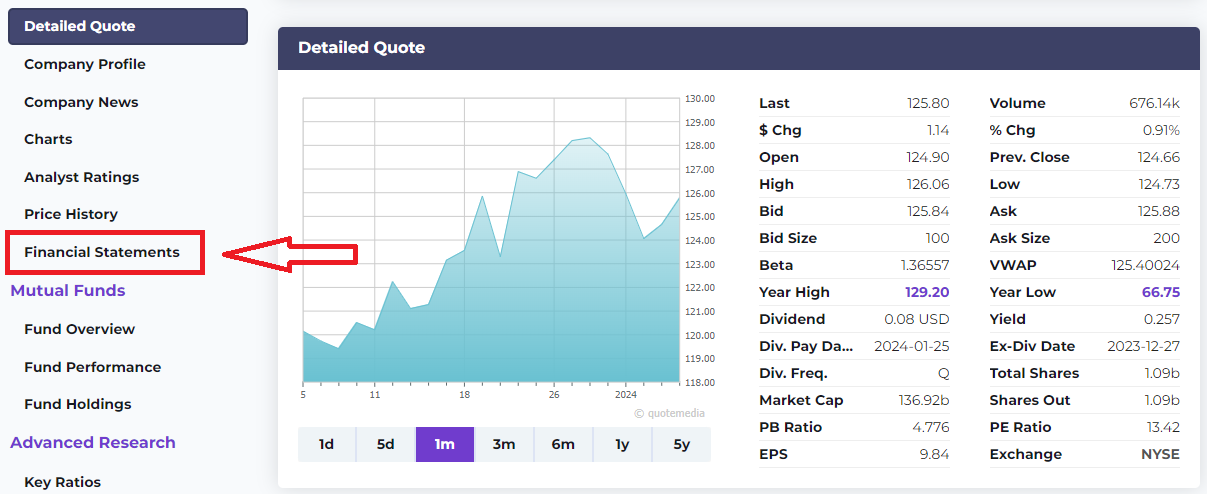
Now that you have the first ticker symbol, we will need to find its price. From the “Symbol Lookup” page you opened, get the Last Price for this company. It will be the first value in the quote details.
Earnings Per Share (EPS)
When you buy stock in a company, it means you also get a share of all of its assets and profits – so we want to know how profitable this company is. For this, we will look at Earnings Per Share (or EPS).
Earnings Per Share (EPS) – Continued
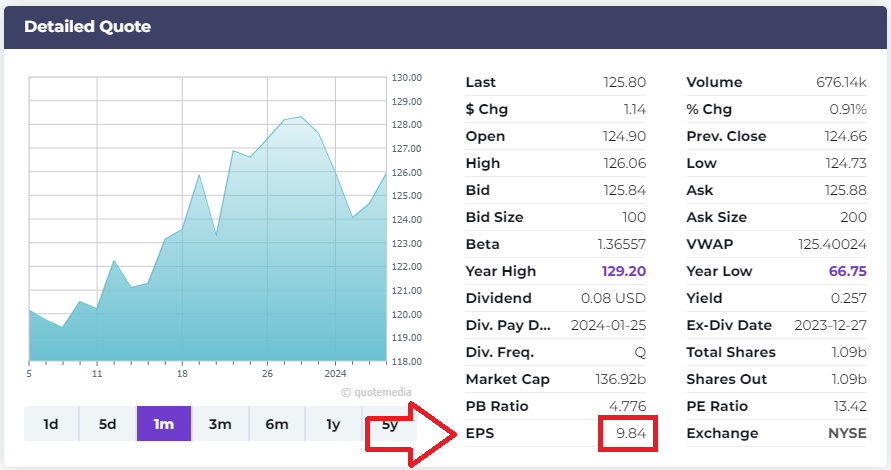
EPS is calculated by taking the total net revenue (revenue minus expenses) of this company over the last year, and dividing it by the number of shares. This is the net “profit” earned by each share of the company’s stock.
EPS is also included in detailed stock quotes – you do not need to calculate it yourself. Go back to your Detailed Quote, and write down this stock’s EPS.
Dividends
Companies can choose whether to keep their profits as retained earnings (and re-invest them into future growth), or pay them out as dividends to the shareholders.
This is one of the reasons why you should only directly compare stocks in the same industry or sector – some sectors (like utilities) tend to pay out most of their profits as dividends, while other sectors (like technology) tend to re-invest profits, with lower dividends, so they cannot be compared apples-to-apples.
ContinueDividends – Continued
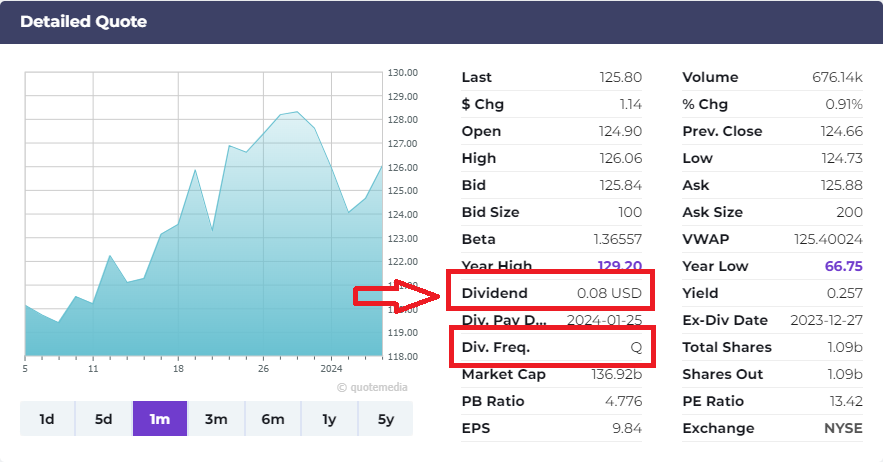
Dividends are usually paid quarterly – the detailed quote will confirm this by saying “Q” for the dividend frequency. If it says “A”, it means it is paid annually (so divide the dividend by 4 to get the quarterly dividend), or M for monthly (so multiply by 3 to get the quarterly dividend).
From the detailed quote, write down this stock’s last quarterly dividend. If it is blank, this company does not pay a dividend, so enter “0”.
Net Income Trend
To make an informed decision, we will want to look deeper than just the information on the quote – we also want to look at their Financial Statements (Income Statement, Balance Sheet, and Cash Flow Statement), and see how some key indicators are moving over time.
To start with, we will want to look at the Income Statement. From the Quotes page, select “Financial Statements” in the menu.
Net Income Trend – Continued
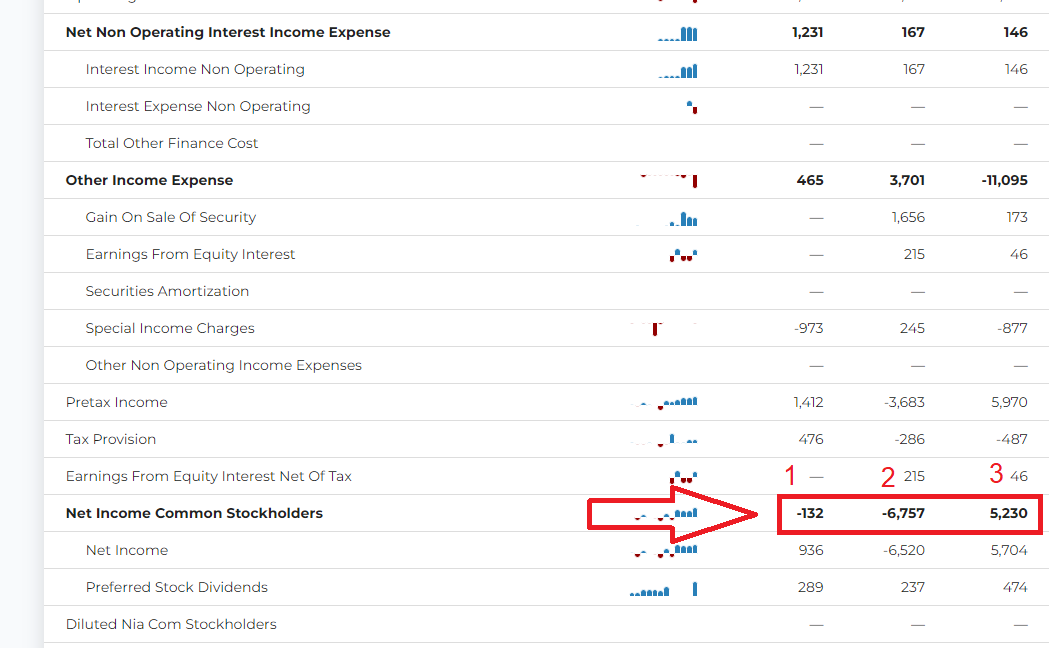
The first financial statement you will see is the Income Statement. Here, we want to get the Net Income for Common Stockholders – how much net income (or profit) was earned by this company at the end of each year.
We want to see if this has been going up or down over time – so write down the net income from each of the last 3 years (most recent year first).
Common Stock Equity Trend
The next thing we want to look at is “has this company become more valuable over the last year”. Remember – a stock’s price is based on what buyers and sellers today are willing to pay for it – which may be disconnected to the actual underlying value of the company.
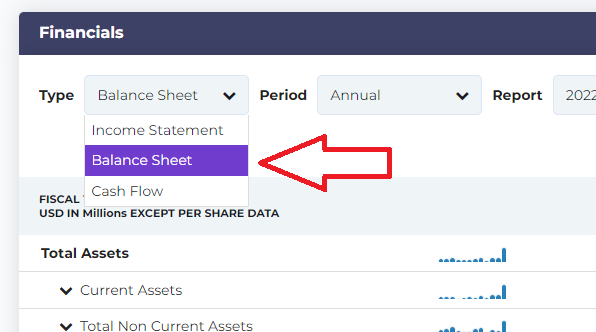
To find the real underlying value, we need to look at the “Balance Sheet”, which shows the final financial position at the end of each year. Switch the financial statement to the “Balance Sheet” using the selector near the top of the research page.
Common Stock Equity Trend – Continued
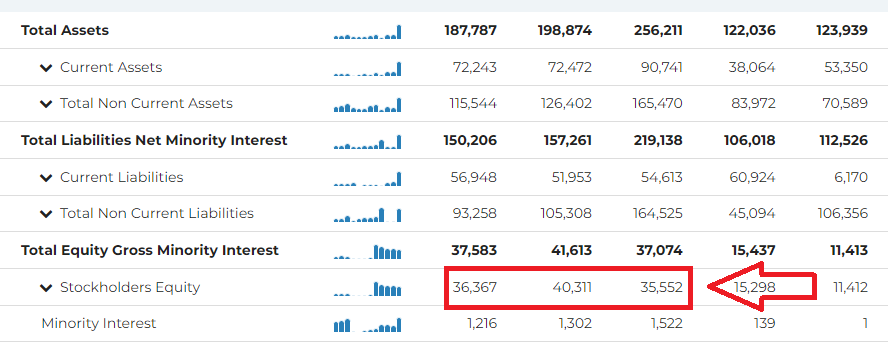
Just like individuals, companies have a “Net Worth” – their total assets minus their total liabilities. This is called “Shareholder’s Equity” or “Stockholder’s Equity”, and we want to see if this has been going up or down over the last three years.
Write down the Stockholder’s Equity from each of the last 3 years (most recent year first).
Cash Flow Trend
Even profitable companies can end up in big trouble if they end up with a shortage in cash to pay immediate bills. Next, we want to identify if this company’s cash position has changed over time.
To do this, we will look at their Cash Flow Statement. From their Income Statement, change the “Type” to “Cash Flow”.
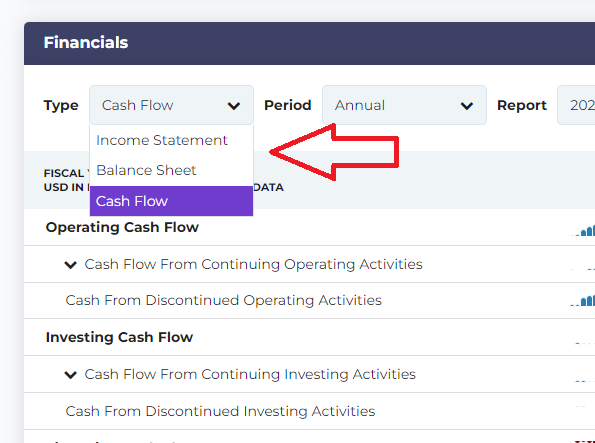
Cash Flow Trend – Continued
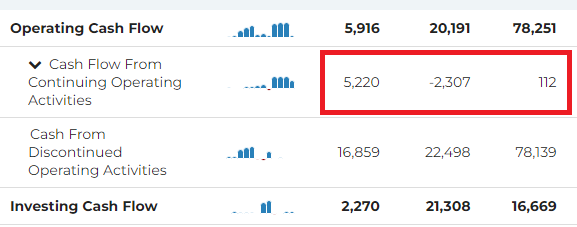
We want to get the last 3 years of their Operating Cash Flow from Continuing Operations – how much cash is generated from their normal business operations (we only want “continuing operations” so we don’t include cash from parts of this business that may have been sold off).
We want to see if this has been going up or down over time – so write down the Operating Cash Flow From Continuing Operations from each of the last 3 years (most recent year first).
Price Change
So far, the information you have pulled up from the financial statements is the building blocks of “Fundamental Analysis”. This will help you see if the underlying business in this company has been improving or not over time.
But the price of a stock is based on what other investors are willing to pay for it. That means we need to get some idea of how the price has been moving. This is the cornerstone of “Technical Analysis”.
This can get very detailed, but we will look at some basics for your first stock.
ContinuePrice Change – Continued
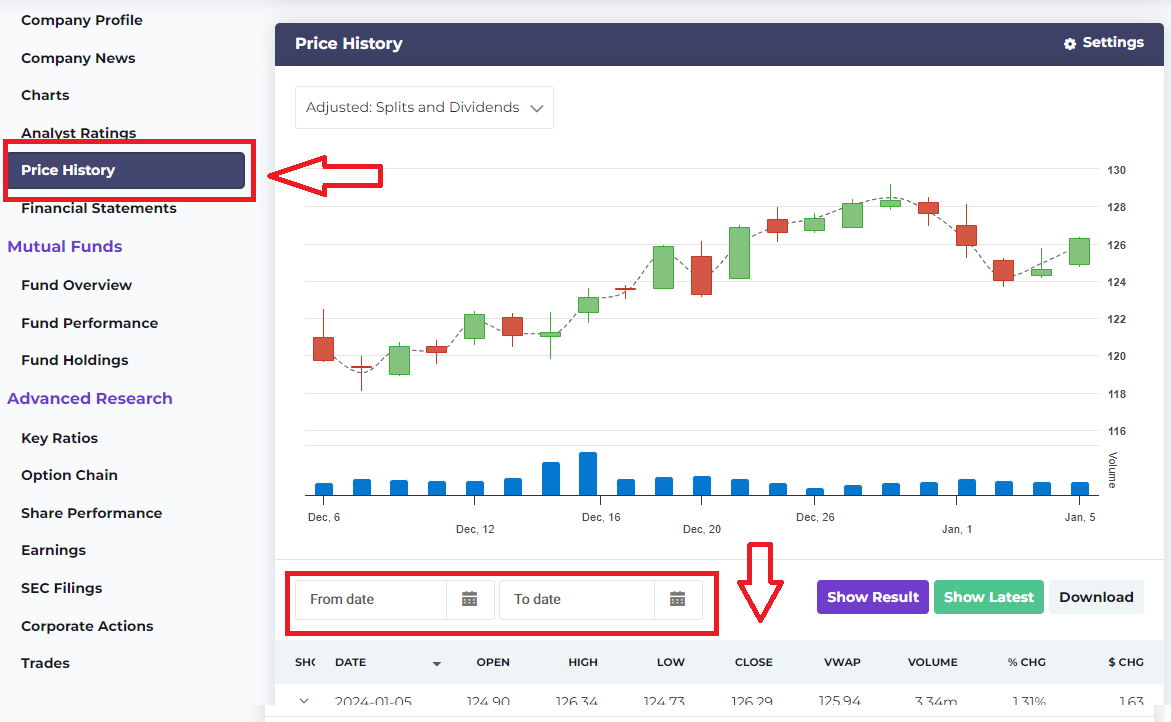
In the research tool, click “Price History” on the left hand menu. This will bring up the historical prices for this stock.
Use the date range to select the entire last year (from now to 1 year ago), and write down what this stock’s “Close” price was one year ago so we can see how much it has changed.
Volatility
Just looking at the price change over the last year is not the full picture – we also care about how much this stock’s price swings up and down over time.
As an investor, you generally prefer stocks that consistently gain value over time – not wildly swing up and down. How much a stock’s price moves up and down over time is called “Volatility”.
ContinueVolatility – Continued
With the Price History tool you already loaded, you should now see a chart showing the stock’s price over the last year.
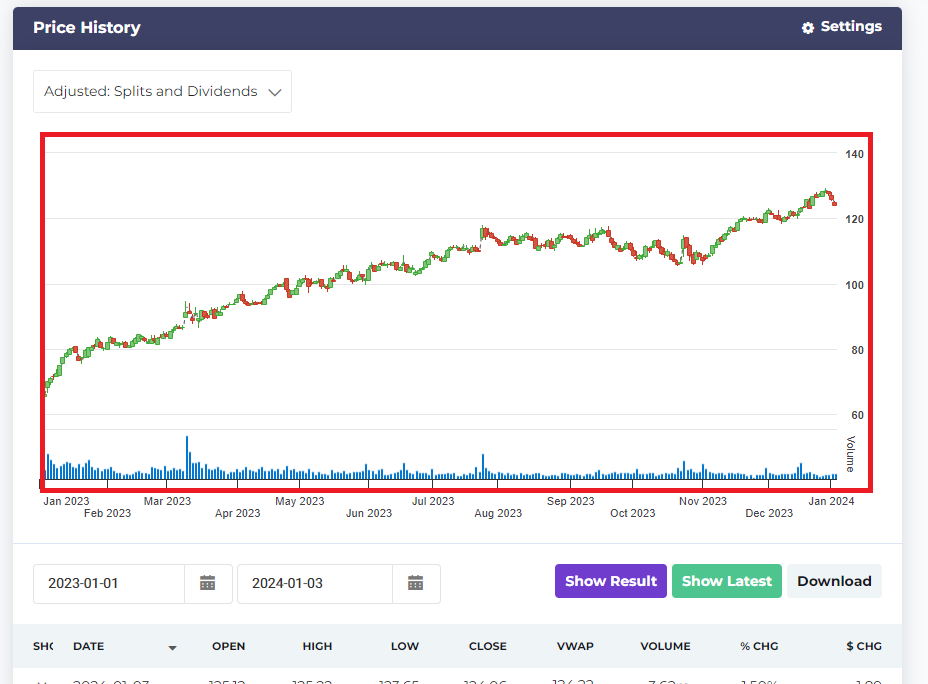
Based on what you see, make a guess as to how “volitile” this stock has been – “Low” (not many big spikes or pits), “Medium”, or “High” (the stock’s price is constantly making big swings up and down).
ContinueNews
Now we have some good information to start making an informed decision. The last thing to take a look at is the news – what’s the “buzz” around Wall Street about this stock?
A lot of news for some companies might just be the stock being mentioned in an article with a dozen other stocks. Some might be the company’s own press releases, or filings with the SEC (which may be harder to understand). For bigger, more well-known companies, there might be articles by analysts giving a detailed opinion on this stock.
ContinueNews – Continued
In the Research Tool, select “Company News” to load recent news stories about this stock.
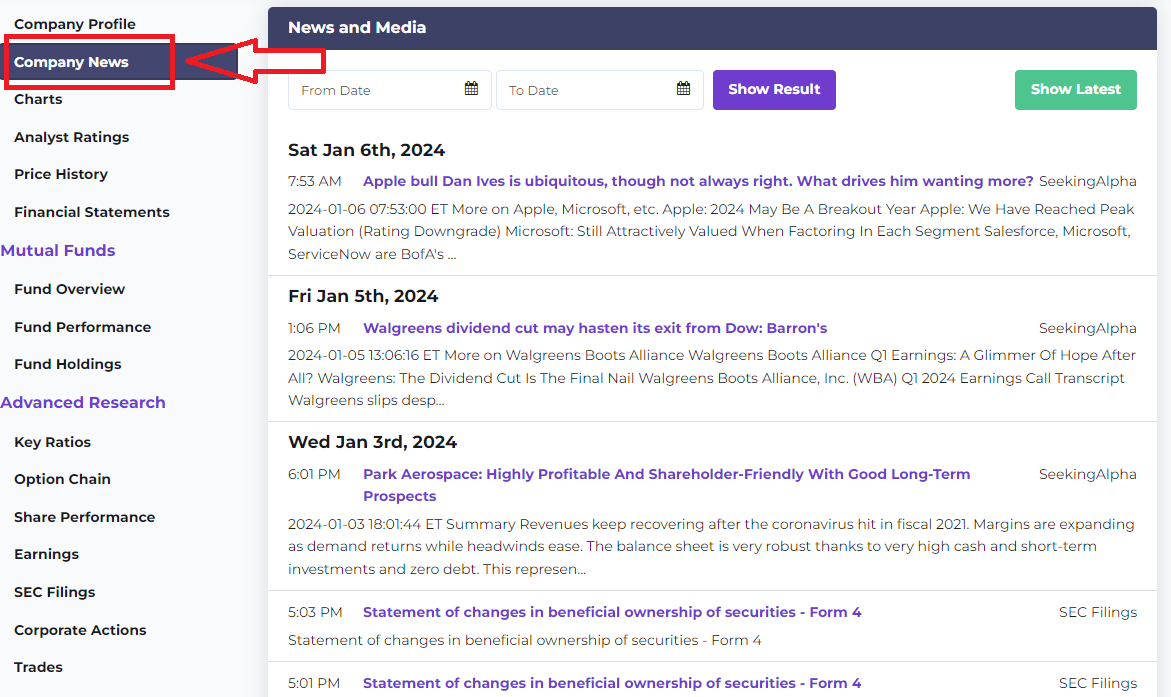
Open a few of the newest articles about this stock and skim them to see the general sentiment. Write down if you think right now this stock generally has Good News, Neutral News, or Bad News.
ContinueMaking A Comparison
Now we have a lot of data points for this first stock – but to make an informed decision, you need to compare it with something else.
We use a Stock Screener to find another company in the same sector as the one you just analyzed so we can make a comparison before we decide whether or not this stock is a good investment.
ContinueMaking A Comparison – Continued
Before we can use the stock screener, first we need to know this company’s Sector and Industry.
Companies generally get divided into 12 main “sectors”, and further divided in each sector into many “Industries” to help investors sort and compare stocks against “Peers”. We need to know this to find a stock to compare against.
In the research tool, click “Company Profile”, and scroll towards the bottom. The company’s Sector and Industry are listed under “Industry Classifications”.
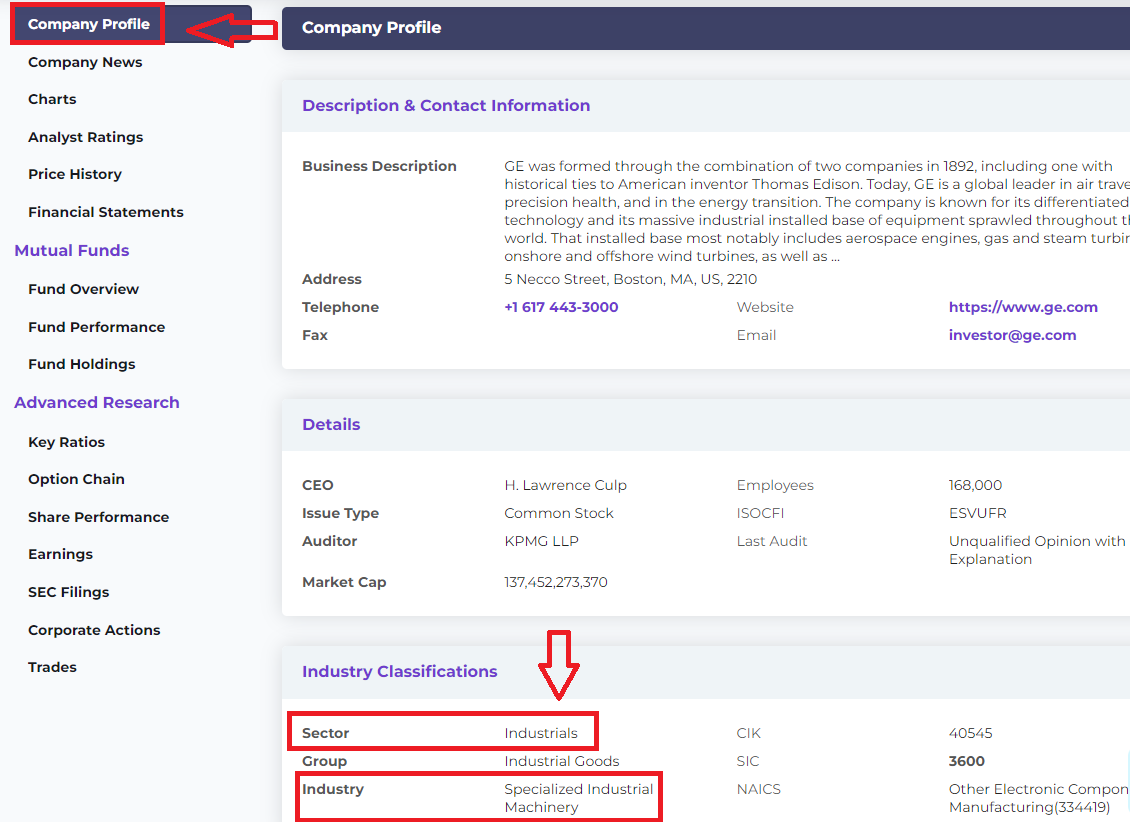
Make a note of this company’s Sector and Industry, and click “Continue” to see how to use the Stock Screener to find a comparable stock.
ContinueMaking A Comparison – Continued
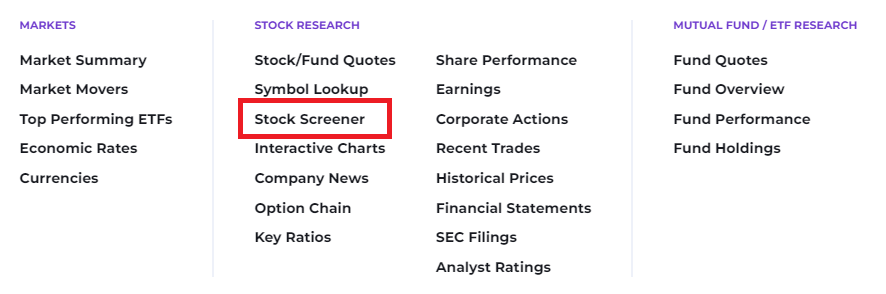
Under “Investing Research” on the main menu, go to “Stock Screener” (make sure to open in a new tab).
Making A Comparison – Continued
Once you have the screener up, click on “Filters” on the right side, and use this to filter just to stocks in the same industry or sector.
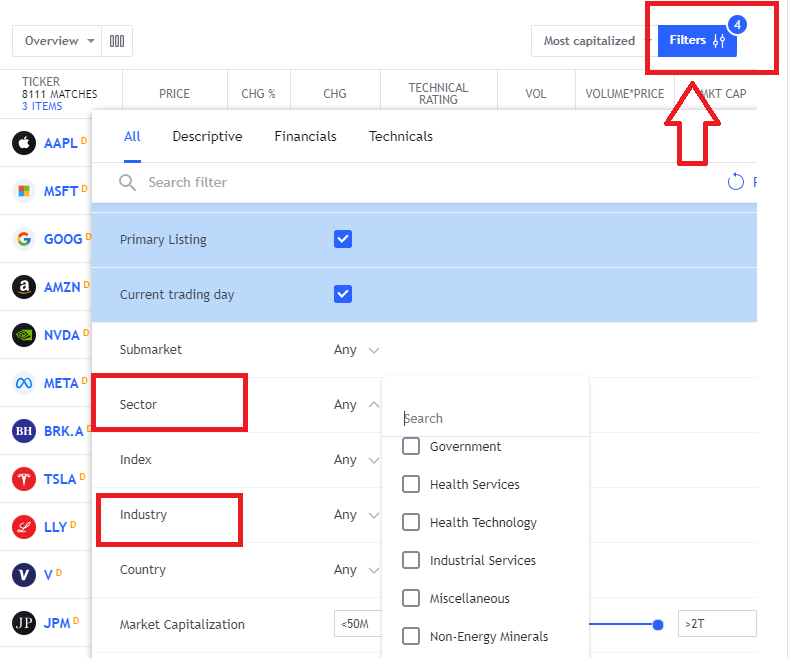
It is ideal to compare against a stock that is in the same industry (as they companies should be more similar), but for your first comparisons, it is okay to compare within the same sector, which will likely show more companies you will easily recognize.
Pick one of the biggest companes in the same sector as the company you already researched, and write its ticker symbol down in the “Comparison Ticker” box, next to your first ticker.
ContinueMaking A Comparison – Continued
Now that you have a stock to compare against, repeat all the steps from your first company to gather all the relevant information about this new company too.
ContinueMaking A Decision
Based on everything you’ve entered so far, was the winner of most of the points we analyzed.
This does not necessarily mean that it is the best choice – now is the time to use your judgement. Based on what you’ve seen in each of these points, which stock do you think is a better choice?
Keep in mind that you should also diversify your portfolio – when you first start out, you should try to buy 5 different stocks, each in a different sector (which is why we are comparing stocks in the same sector, so you can choose between them).
Make your trade now – or if you aren’t satisfied with either stock, use this exercise to compare some others!
Continue