How to Choose Stocks Strategically
The most challenging part of starting to invest is picking the first few stocks to add to your portfolio. Every investor has their own techniques and strategies, but we want to give you the tools you need to place your first trades, and get your portfolio off to a good start.
Establish Goals
Before choosing your first stock to invest in, the first step is deciding what your goals are for your portfolio.
Risk and Reward
Risk versus reward in investing refers to the relationship between the potential gains and losses that come with investing in a particular company or stock. While investing can provide the opportunity for significant financial gains, there is always some degree of risk involved.
When choosing your first company or stock to invest in, it is important to consider the potential risks and rewards. Generally, the more risk you are willing to take on, the greater the potential rewards may be. For example, investing in a startup company may have higher potential returns, but also comes with a greater risk of failure than investing in a more established company.
On the other hand, investing in a well-established, stable company with a strong track record may provide more predictable returns, but may not have the same potential for significant growth.
Diversification
Diversification means that an investor spreads their assets across a variety of investments to minimize risk and increase the potential for rewards. Risk and reward go hand in hand, meaning an investor must always balance the potential benefits of investing with the risks associated with those investments.
Diversification is an effective way to manage that balance by investing in various assets with different levels of risk and reward, which can help investors achieve their financial goals with greater confidence while reducing the impact of losses.
Once you establish the minimum number of securities you need, you can now start handpicking stock symbols by using a trading strategy. You can also create a mix of these strategies to get the best of each one.
Trading Strategies for Beginners
The goal of your trading strategy is to get a list of stocks or ETFs that you might want to invest in. You want to put together a wish list of all the potential options, where only half (or fewer) of your initial picks will be added to your permanent portfolio.
Once you have an initial list put together, you’ll narrow it down based on how well the companies fit into your investing strategy.
Your time horizon will influence how risky you can be with your investment choices. Time horizon in investing refers to the length of time an investor plans to hold an investment before selling it. The longer your time horizon, the more risk you can afford to take on, since you’ll have more time to make corrections to your portfolio if some of your investment choices lose money.
The “Invest in What You Know” Strategy
Rather than relying on complex financial models and analysis to evaluate investment opportunities, investors who follow this strategy focus on industries or companies they know well. This means they tend to invest in companies that sell products or services they use frequently or know a lot about, as well as industries or sectors they have experience in from work or hobbies.
It’s still essential to conduct thorough research and consider factors such as company financials, market conditions, and overall portfolio diversification, even when investing in areas you know well.
When getting started, ask yourself the following questions to get a sense for how household brands and companies are doing.
- Have they started to open new stores around me lately, or are their products less available?
- Do a lot of people you know use their products, or are they more obscure?
- Does their current news look positive or negative?
If all three of these are positive, then this might be a good place to invest.
The Earnings Strategy
An earnings strategy is a type of investment approach where investors take positions, (either short or long positions) in the stock of a company before or after it is anticipated to release a negative earnings report. You can use the earnings calendar to review upcoming earnings reports for publicly traded companies.
Going long involves buying a security with the expectation that its value will rise over time. If the price of the security increases, the investor profits by selling the security at the higher price. Going long is the most common type of position, and it is the opposite of going short.
Going short, on the other hand, is when an investor sells a security with the expectation that its value will decline. If the price falls as expected, the investor can buy the security back at the lower price and profit from the price difference.
Short selling is considered a more risky strategy since it involves the potential for unlimited losses if the security rises in price instead of falling.
The focus of the earnings strategy is to try and profit from the stock price movements that happen when a company reports better earnings than it did in previous quarters, or than what analysts were expecting. The basic idea is that companies that are producing better earnings could inspire investors and analysts alike to invest in a company’s stock, positively affecting the price.
The earning strategy is somewhat of an evolution of the “invest in what you know” strategy. You will be looking for companies that you believe will have high earnings announcements coming up soon, which can cause their stock price to rise.
It’s very important to analyze each company, and back-up your assumption of how the market will react to their earnings report.
Check out our lesson called, 5 Ways to Get Investing Ideas to get some examples of earnings reports affecting investor sentiment (and stock prices).
The Passive Strategy
If you aren’t sure which stocks to pick, you can always invest in ETFs and market indices. These products are already diversified and will track a specific market or commodity for you.
Let’s say you wanted to invest in a gaming company, but didn’t know which company in particular. You could choose to invest in an ETF like, PureFunds Video Game Tech ETF (GAMR) that tracks the gaming market. Based on Seeking Alpha, they have invested in gaming software firms such as Ubisoft, Activision, Konami etc. This means the stock picking and allocation tasks have been taken care of by the fund managers of this ETF.
You can find a list of ETFs etfdb.com.
Many investors start with a passive strategy, and slowly invest into particular companies later when they’re more familiar with the different markets and sectors. This would mean starting your portfolio by picking ETFs in multiple industries you want to invest in, then looking at each of these industries in detail.
Once you identify some stocks within those industries that would fit within your overall strategy; you can sell off some of the ETFs you’re holding, and use the money to invest in the stocks you researched instead.
The Stock Screeners Strategy
You can also use stock screeners to find good purchases and short sales. A stock screener is a program or website that will ask you some questions about what you are looking for in a stock, and return a list of stocks that match your criteria. Then, you can do additional research on these stocks to determine if they should be added to your portfolio.
Below is a review of the research pages available on our site, so you can get familiar with how to conduct your investing research.
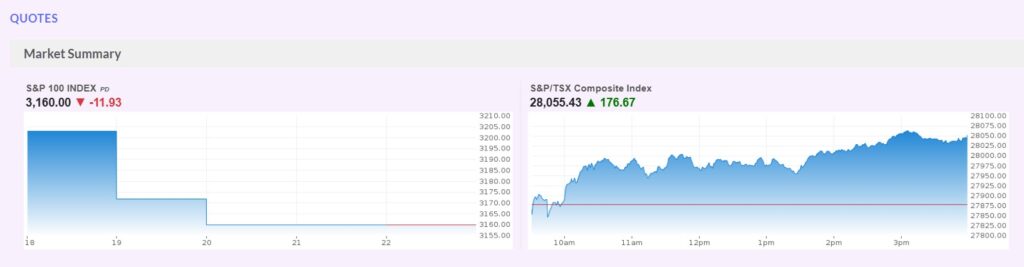
Today’s Market Summary
This page is very useful at the start of your research. It presents the day’s market summary, showing you how the overall market is doing today. It is always important to review how the overall market is doing and the market news today. This can help you to capture the perfect timing to buy stocks at their lowest price (or to short sell them at their peak).
Earnings Release
The Earnings Release page presents stocks’ quarterly earnings pre-announcements, with the current estimate and new range. A stock’s volatility increases when it is near the earnings report.
Analyst Ratings
The Analyst Ratings page presents the recommendations given by brokerage firms and financial analysts. This page will be useful to analyze a stock’s recommendation trend and the current average recommendation.
Best/Worst ETFs
Looking for an ETF? This page is a great place to see what ETFs are currently doing well, and which ones aren’t. These ETFs can signal current market trends and help you make choices based on that.
Popular Stocks
Wondering what other users are trading? This page presents our popular stocks and mutual funds. We also present top gainers and losers and hot stories that are moving the market today.
Upgrades/Downgrades
The Upgrade/Downgrade page presents all the changes in analysts’ recommendation for stocks to buy or sell.
Picking Stocks – Intermediate Analysis
Now that you have a couple of stocks in mind, you should perform a more advanced analysis of your stock picks. This extra step of your research will be useful for two major reasons:
- To verify if these stocks are truly good investments.
- To help you back up your assumptions so you can answer questions about the reasoning behind your selection.
This is where you can pick the stocks that you’ll add to your portfolio. If you started with a passive strategy, your portfolio might already have some industry ETFs, but now we will be looking at specific companies to replace some of these investments.
We will explore a couple basic research methods that will complement your findings on your stock picks.
Technical Analysis
Technical analysis seeks to predict future movements of an asset, such as stocks, by analyzing charts and statistical trends of past market data. The main goal of technical analysis is to use historical price and volume data to identify trading opportunities and determine the best time to buy or sell a security.
Technical analysts usually use charting software and data analytics tools to create charts and graphical representations of market trends to identify potential investment opportunities.
We will review a few basic chart patterns with real-life examples.
Trends & Trend lines
A trendline is a straight line that connects the stock’s price movement together and creates an upward or downward pattern. It is often recommended to connect more than 2 points to have a stronger trend line.
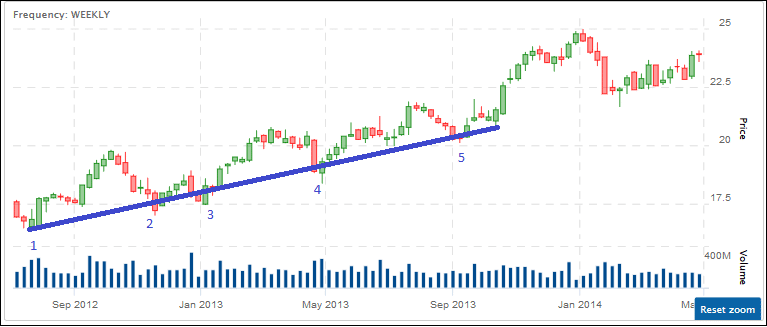
Trendlines are useful to give you an idea of the general direction of how a stock’s price is moving. A positive trendline does not mean it will keep going up forever, but can be an indication that there is a strong underlying business foundation.
Support & Resistance
Both support and resistance lines are zones where the price has difficulty passing through. The support line is where the price has difficulty to pass below it and will bounce back up instead. The support is an area where a lot of traders have placed their orders to buy the stock at that price. If there are more buyers than sellers at this level the price will increase instead of continuing to fall. In other words, it is the point at which the stock struggles to go under.
On the other side, a resistance line is where the price has difficulty going higher than that level, and it will bounce back down. The resistance is an area where a lot of traders have placed their sell orders on the stock at that price. If there are more sellers than buyers at this level the price will bounce and go down. The resistance line represents the price level where the stock struggles to go above.
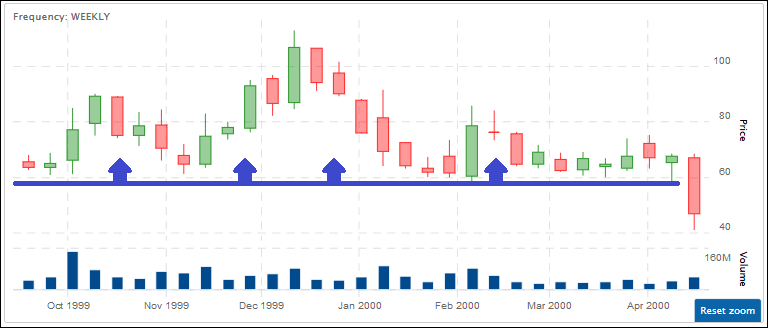
Stocks near their support lines tend to rebound, so they might make a good investment (at least in the short term). Stocks near their resistance line tend to fall back down, so they might signal a shorting opportunity.
When a stock breaks through their support or resistance lines, it is called a breakout.
Symmetrical Triangle
This pattern consists of two trend lines which are symmetrical to the horizontal and are convergent. To prove a symmetrical triangle, one must have oscillation between the two lines.
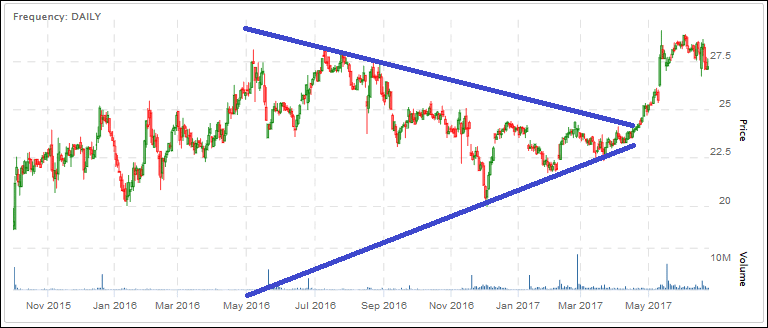
A triangle pattern indicates that the price is about to move – but a symmetrical triangle does not give a clear indication that the price will go up or down.
Ascending Triangle
The ascending triangle pattern refers to two converging trend lines. The first line is an upward slant, which is the support, and the other is a horizontal resistance line. To validate the ascending triangle, there must be an oscillation between the two lines.
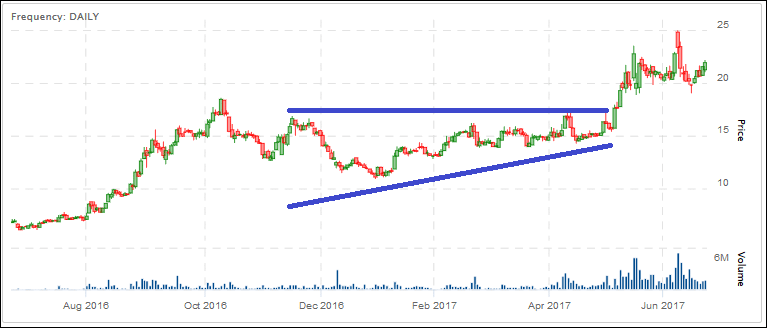
This triangle implies a bullish continuation pattern.
Descending Triangle
The descending triangle pattern refers to two converging trend lines. The first line is an downward slant, which is the support, and the other is a horizontal resistance line. To validate the ascending triangle, there must be an oscillation between the two lines.
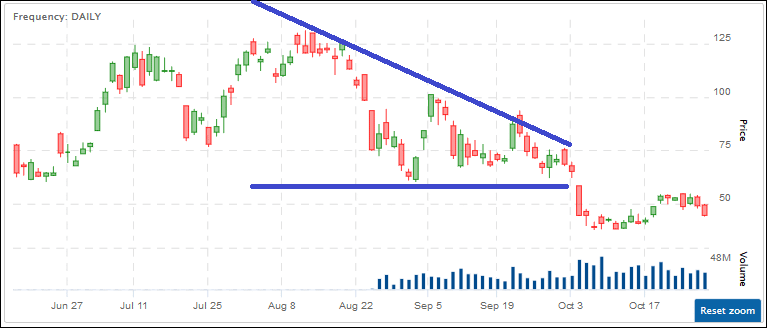
This triangle implies a bearish continuation pattern.
Fundamental Analysis
Functional analysis is the process of evaluating the intrinsic value of an asset, such as a stock, by analyzing the underlying fundamentals of the company or the asset.
This approach involves reviewing financial statements, industry trends, economic data, and other relevant information to identify investments that are priced below their intrinsic value and to identify long-term investment opportunities.
This type of analysis often involves a lot of research and due diligence, and is typically used by long-term investors who plan to hold onto their investments for extended time periods.
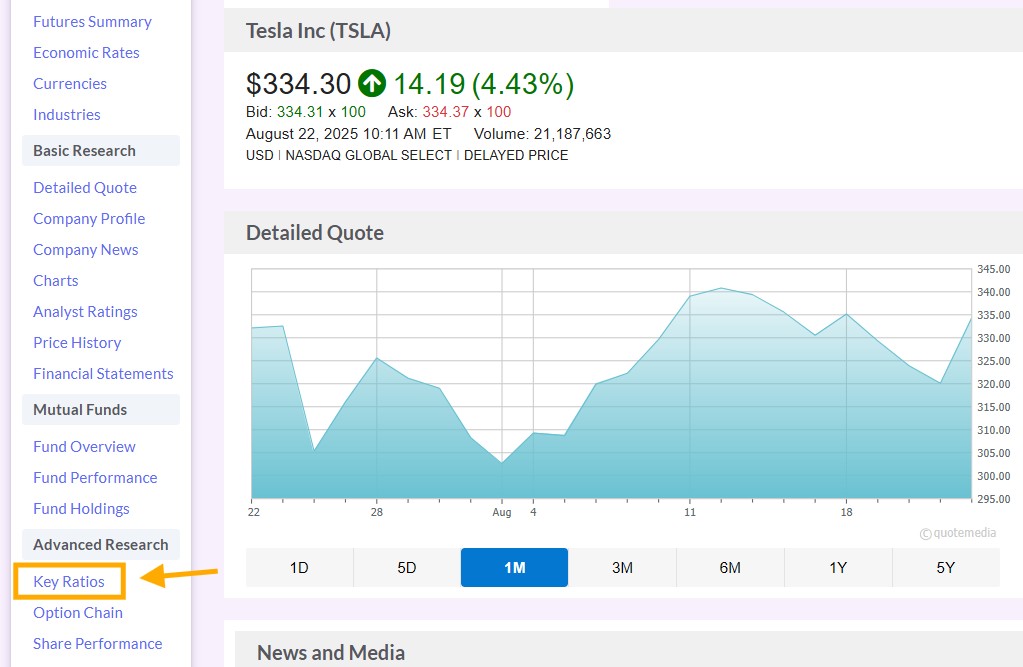
Fundamental analysis involves reviewing key ratios and sections of a company’s financial statements to define its health and attractiveness. Since financial statements are standard between companies, this can help compare two potential investments apples-to-apples. To make things easier, you can directly find most of the ratios by clicking on “Key Ratios” in the quotes tool on our site.
One of the most popular and simple fundamental analysis is the DuPont model. The DuPont Analysis breaks down the firm’s return on equity (ROE) based on its profitability decisions. Which means how efficiently are their assets utilized, and what is their financial leverage?
The model focuses on the profitability of a firm using the following equation:

This equation can be re-written as:

To analyze a company using the Dupont Model, you can use the following tables:
Analysis of Company XYZ from 20XX to 20XX
| DuPont Model Components | 20XX | 20XX | 20XX | 20XX |
| Net Income | ||||
| Equity | ||||
| Net Sales | ||||
| Average Total Assets | ||||
| Average Shareholders’ Equity | ||||
| Profit Margin | ||||
| Asset Turnover | ||||
| Equity Multiplier | ||||
| ROE |
Analysis of Company XYZ with Industry Competitors
| DuPont Model Components | Company XYZ | Company A | Company B |
| Net Income | |||
| Equity | |||
| Net Sales | |||
| Average Total Assets | |||
| Average Shareholders’ Equity | |||
| Profit Margin | |||
| Asset Turnover | |||
| Equity Multiplier | |||
| ROE |
These tables will allow you to see the evolution of a company in terms of its profitability. This can be useful for showing how profitable the company could be over the long-term. This analysis will also give you the bird’s eye view of a company and its competitors in the same industry. By doing this, you might find a competitor that would be a better stock pick or reassure yourself that your stock pick is the best in its category.
Try It Yourself
Ready to do your first real stock comparison? Our Stock Comparison Tool will walk you through the fundamentals!