7-00 Chapter 7: Technical Analysis – Common Charts and Terms
There has been a long debate between technical analysis and fundamental analysis. Is technical analysis necessary?
The answer is YES!! A price action is always a technical short-term decision.
Not long ago, technical analysis was considered the opposite of fundamental analysis. Rather than looking at a company’s products, its competitors and how much profit it makes, technical analysis looks at 2 things only: the price movements of a stock, and the volume of shares traded at those prices. From these 2 data points, technical analysts locate patterns in stock price behavior, and surprisingly, more and more investors are seeing technical analysis as a complement to, not the opposite of, fundamental analysis.
Fundamental analysis, (for example, Buy and Hold investing) is a longer-term approach that investors use who want to hold their assets, (stocks, futures, FX) for a longer time period. They are mainly basing their decisions on criteria that do not change overnight. Fundamental focused investment decisions will not be bought in the morning and sold it in the afternoon. This is not their time horizon for their investing strategies.
Technical focused investors use short-term technical analysis to buy and sell stocks and hold for short periods of time, from 15 minutes to a couple of weeks. They are establishing their decisions based on:
- Price movements that follow a repetitive predictable trend.
- The investor sentiment, the short-term emotional swings of investors that are the driving power behind price movements and can be seen on a chart.
Technical investors have less risk than fundamental investors. They can be more certain of what will happen tomorrow than what will happen a year from now. They win and lose according to their plan, while fundamental investors hold and wait for a change in a company’s fundamentals, (earnings, news, etc.) before they make their decision on exiting the trade.
Long-term technical investors use charts for entry and exists. They believe that all the fundamental information is already baked into the price.
Take for example the recent price of the top NASDAQ 100 stock symbol QQQ.
The technical focused investor will look at price history over a period, let’s say over a year. We add on top of that moving averages to determine what the price is doing. You can see that the price is making higher highs and higher lows (i.e., the share price is increasing in value).
In the chart below we can see 3 moving averages, (9,20, and the 200).
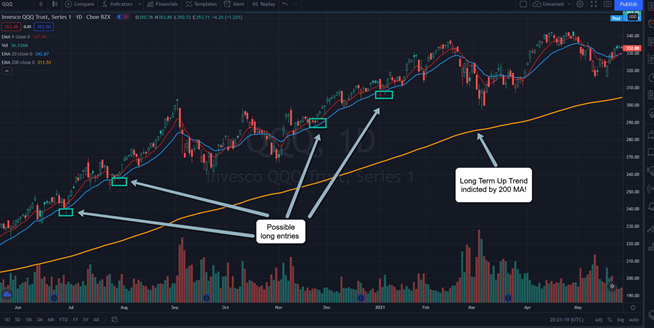
The 200 is the longer-term moving average, (the yellow color) which indicates that the price is in an “upward” move.
The 9 and the 20 MAS are the shorter-term moving averages, (red and blue) which a technical investor can use to time his/her entry to take advantage of the ebb and flow of price fluctuations.
So, the key to technical analysis is the history of prices paid for a stock and the volume of shares traded. We could create a history of the price paid for a stock by looking in the Wall Street Journal everyday and noting the closing price from yesterday. We could write down this price and then create a table to see the history of prices paid, like this:
Stock Prices of Google (GOOG) in December of 2009
| Date | Open | High | Low | Close | Volume | Adj Close* |
|---|---|---|---|---|---|---|
| 18-Dec-09 | 596.03 | 598.93 | 595.00 | 596.42 | 3,531,500 | 596.42 |
| 17-Dec-09 | 596.44 | 597.64 | 593.76 | 593.94 | 2,638,800 | 593.94 |
| 16-Dec-09 | 598.60 | 600.37 | 596.64 | 597.76 | 2,809,400 | 597.76 |
| 15-Dec-09 | 593.30 | 596.38 | 590.99 | 593.14 | 2,263,700 | 593.14 |
| 14-Dec-09 | 595.35 | 597.31 | 592.61 | 595.73 | 1,913,400 | 595.73 |
| 11-Dec-09 | 594.68 | 594.75 | 587.73 | 590.51 | 1,720,000 | 590.51 |
| 10-Dec-09 | 590.44 | 594.71 | 590.41 | 591.50 | 1,668,300 | 591.50 |
| 9-Dec-09 | 587.50 | 589.33 | 583.58 | 589.02 | 1,781,000 | 589.02 |
| 8-Dec-09 | 583.50 | 590.66 | 582.00 | 587.05 | 1,524,000 | 587.05 |
| 7-Dec-09 | 584.21 | 588.69 | 581.00 | 586.25 | 1,636,200 | 586.25 |
| 4-Dec-09 | 593.02 | 594.83 | 579.18 | 585.01 | 2,513,600 | 585.01 |
| 3-Dec-09 | 589.04 | 591.45 | 585.00 | 585.74 | 1,428,700 | 585.74 |
| 2-Dec-09 | 591.00 | 593.01 | 586.22 | 587.51 | 1,663,200 | 587.51 |
| 1-Dec-09 | 588.13 | 591.22 | 583.00 | 589.87 | 2,320,300 | 589.87 |
However, this method of tracking prices does not easily reveal trends and patterns. Thanks to modern computer technology, technical analysis has become an acceptable research tool and not just a strange science. If we chart this data, where price is vertical and time horizontal, we will be able to see a picture of these numbers:
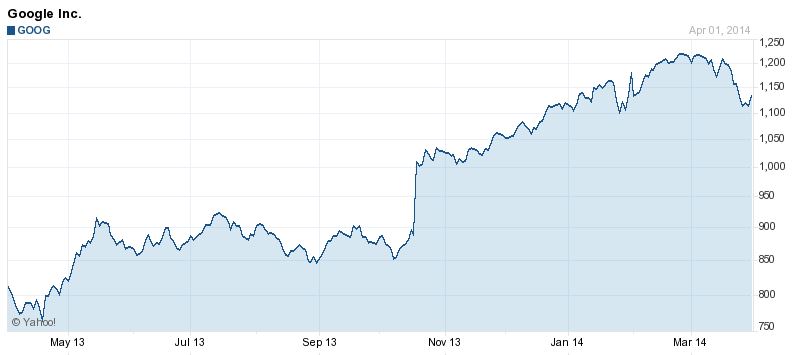
From this chart, we can easily see that Google has risen steadily over this time period. Now, which would you rather look at, the table or the chart? Of course, the chart!!!