7-11 Moving Averages
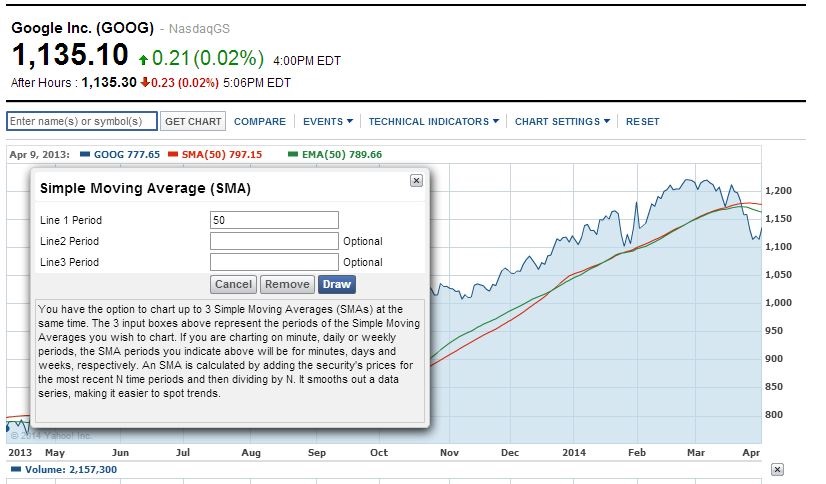
Moving averages are among the most popular, and easy to use and understand trading “tools” available to you. Also, moving averages are used as components in many other charts and analyses. By smoothing out data points and number series, moving averages make it easier to identify trends and tendencies.
The most common examples are the simple moving average (SMA) and the exponential moving average (EMA). The SMA is generated by calculating the average price (usually closing price is used) over a number of time periods. An EMA attempts to better identify the built in “time lag” by creating a weighted average, assigning more weight to the most recent prices to allow for the more current data to factor more prominently in future trends.

There are many types of moving averages, (SMA, EMA, HMA, etc.). Which one is the best one?
I like to use the EMA (Exponential Moving Average) because it gives more weight to the last price candlesticks and therefore moves faster than the SMA (Simple Moving Average).
- During strong uptrends, pullbacks tend to halt at or near the rising 21-day EMA and represent strong buy opportunities.
- During strong downtrends, rallies tend to halt at or near the 21-period EMA and represent strong sell opportunities.
When 2 EMA cross, this can signal the beginning of a trend from either up to down, or visa versa. For example; when the 21-day EMA crosses the 8-day EMA you will see the beginning of an uptrend. Reference the chart below for QQQ, when the shorter time 8 EMA crossed the longer time 21 EMA it indicated the start of an uptrend.

Moving averages are a good tool to identify a trend or the change of a trend, but they are the worst tool to use in a range market. A range-bound market is where prices bounces between a support and resistance line, (a set high and low price).
