7-09 MACD
This is the acronym for “moving average convergence/divergence.” Got it? OK, here’s the simple explanation. This graph shows the difference between a fast- or slow-moving average of a stock’s prices. It is designed to identify significant trend changes. This can be a very important tool for you to anticipate trend movements that may occur in the near future. Even as a modest investor, you may be able to generate knowledge that the mega investors spend many dollars and hours to achieve. Analyzing these graphs can give you the same ability to intelligently project what track a security may follow.
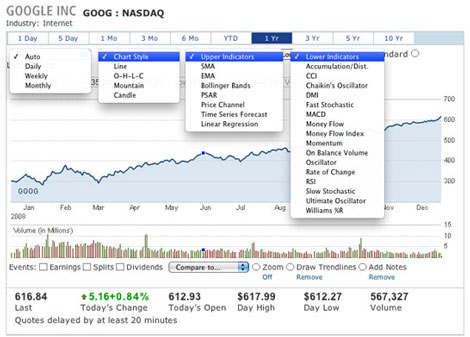
When using the charts on your virtual account, note all of the different indicators you can use (see the chart below)
Moving Average Convergence Divergence
MACD is one of the simplest and most reliable indicators available today. It was developed by Gerald Appel and uses moving averages, which are lagging indicators, to show trends following the characteristics of this centered oscillator. By subtracting the longer moving average from the shorter moving average, a line is created that oscillates above and below zero, without upper and lower limits.
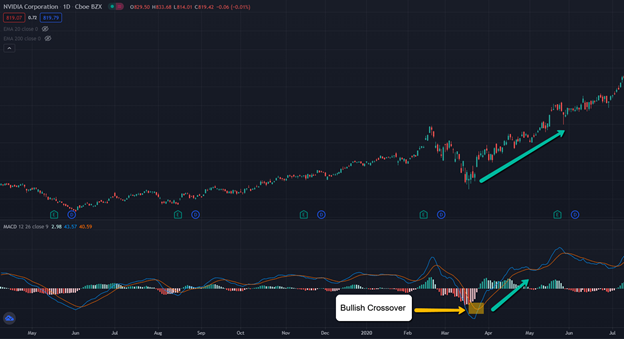
The standard setting for the MACD uses both a 26-day and a 12-day exponential moving average (EMA). The faster (or smaller) 12-day moving average is plotted against the slower moving 26-day moving average. Both are using closing prices. A 9-day EMA is also plotted to act as a trigger line. A bullish crossover occurs when the MACD moves above the 9-day EMA and a bearish crossover occurs when the MACD moves below the 9-day EMA.
When the two lines separate, it means that the trend is becoming stronger because the price is either rising or falling. When they are close together this is when prices move sideways. Reference the chart below for NVDA:
- Blue line – 26-day moving average
- Orange line – 9-day EMA
- Bar graph – 12-day moving average