7-08 Candlesticks
Candlesticks are a type of stock chart developed and originated in 17th century Japan. It can be traced back to the world’s first rice futures exchange in the 1600s. In the mid-1700s, a Japanese man named Munehisa Honma developed a way to track the emotions of traders by looking at patterns of supply and demand on a chart.
In modern day trading, candlestick charts are the preferred tool of analysis for traders and most investors since they provide all the required information at a glimpse.
Candlesticks are made up of different parts to describe the price movements of financial instruments. More emphasis is placed on closing prices, as it relates to the open of the bar within the same day. A candlestick consists of a solid part, the body, and two thinner lines which are called candle wicks or candlestick shadows.
The candlesticks are color-coded to illustrate the direction of the price movements. A green candlestick represents rising prices, whereas a red candlestick shows that the price fell during the day. Long red candlesticks show strong selling pressure.
- The longer a green candlestick is the further the close was above the open. This indicates that the price advanced significantly from open to close and buyers were aggressive.
- The longer a red candlestick is the further the close was below the open. This indicates that prices declined significantly from the open and sellers were aggressive.

Candlestick charts track price movements of a security over a time period. It’s an interesting combination of a line and a bar chart. Candlestick displays are easier to understand than other chart types. The lines represent individual movement while the bars indicate the “range” of price movement. This gives you a combined picture of immediate market moves and short-term trends. They are similar to OHLC (open, high, low, close) charts with more detail and trend data.

There are many kinds of candlestick patterns, here are a few important ones to help you get started.
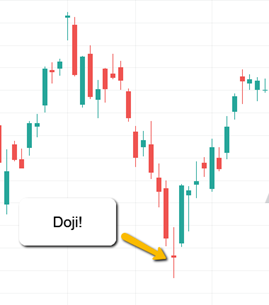
Doji
This type of candle occurs when the opening and closing prices are equal or very close to each other. It is a neutral candlestick, which consists of two shadows of equal length and only a small body. Doji thus indicates a temporary pause and indecision in the trend by traders. If it appears by itself, it is a clear indication of indecision and you should pay attention to it.
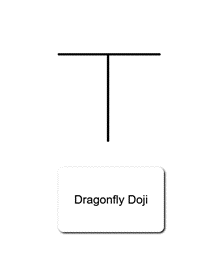
Dragonfly Doji
This candle occurs when the open and close are at the high of the day. In this case, a stock declines for much of the day and rallies to close back at the opening price. This is a strong bullish reversal signal.
Spinning Tops
Spinning tops are candlestick lines that have small bodies with upper and lower shadows that are greater in length than the body. This indicates indecision between the buyers (bulls) and the sellers (bears). The smaller the body relative to the shadows is what makes this a spinning top.

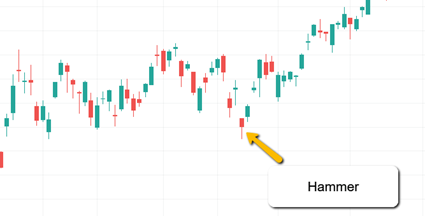
Hammer and Hang Man
The hammer and hanging man are both trend reversal single candles. The hammer occurs in a downtrend, and it is a bullish signal. It shows increasing interest from buyers. The hang man or (hanging man) occurs in an uptrend. It is a bearish signal, and it shows that the sellers have taken interest in the stock.
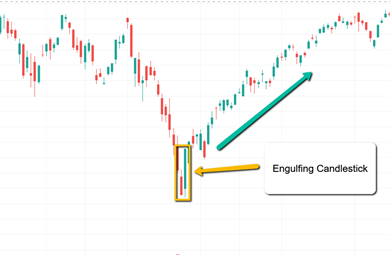
Engulfing Candlestick
This formation is made of two consecutive candlesticks, where the second candlestick is larger that the first candle and engulfs it entirely. The Engulfing formation is a reversal signal. The price then has a higher probability of moving further in the direction of the Engulfing candlestick and reversing the trend.
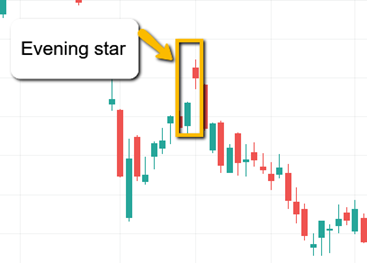
Morning and Evening Star
This formation indicates that the momentum in the current move is slowing and could reverse in the other direction. The morning star is a bullish reversal pattern. The downtrend that has been in place, (as indicated by long red candles) is shifted so that at the next day’s open, prices start lower and trade within a small range and close near the open. The evening star is a bearish opposite of the morning star, it appears in an up trend and has the inverse affect of the morning star. The following days will see the momentum has shifted to a downward trend