7-03 Head and Shoulders
Don’t you love the terminology that pictorially associates these charts with their graphic representations? The Head and Shoulders is an extremely popular pattern among investors because it’s one of the most reliable of all chart formations. It also appears to be an easy one to spot. Novice investors often make the mistake of seeing Head and Shoulders everywhere. Seasoned technical analysts will tell you that it is tough to spot the real occurrences.
The Head and Shoulders pattern can appear either in an upright formation or upside down, each of them indicates different market sentiments. When it is upright, it’s considered a bearish signal and that prices will fall after the formation is complete. When it’s upside down there is a more bullish market sentiment and prices are more likely to rise.
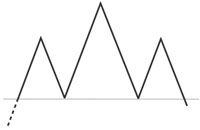
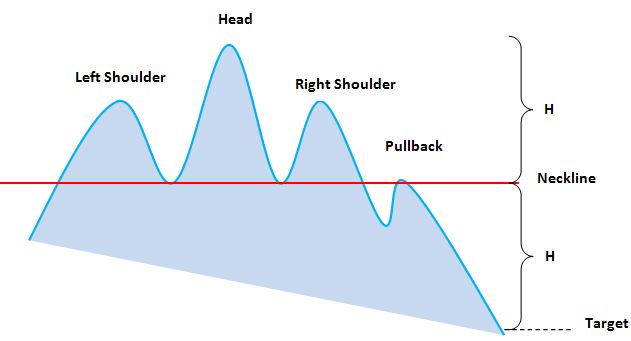
The Head and Shoulder pattern displays market activity and the balance between buyers and sellers. It usually indicates a trend reversal from bullish to bearish or bearish to bullish that will happen in the future. The formation has 4 key parts:
- The Left Shoulder
- The Head
- The Right Shoulder
- The Neckline
The upright formation: the left shoulder is the result of a sustained move upward that forms a peak with a high volume of trades. The market reacts and prices decline as investors start to sell their shares, usually with a lower volume of trades. Quickly, the market value of the stock rallies upward to form the “head” with a heavy daily trading volume. This will create an even higher peak than the left shoulder. Then there is a sell-off period and prices drop, with fewer shares being traded. Subsequently, another rally occurs once the price reaches the neckline for a second time. This forms the right “shoulder” as prices rise, but not has high as the head, when finally another sell off occurs. This is typically with lower volumes, and the “shoulder” is now complete.
This formation occurs when market sentiment changes from bullish to bearish.
The upside down formation: is the mirror image of the previous pattern, where the buying/selling and increasing/decreasing market prices occurs. Analyzing this chart involves learning the reasons, valid or not, for this volatile activity. This formation is considered the change of market sentiment from bearish to bullish.
Take a look at this example of the Head and Shoulders pattern that suggested a breakout higher was imminent. A breakout occurs when a stock’s price moves up quickly above former resistance levels.
Bullish Reversal Head and Shoulders
This formation is mostly visible during the end of a downward trend. The downward trend continues with lower lows that form the left shoulder, then the price retraces upward. The trend continues down and forms the head, confirming the standard trend structure since they form lower lows than the left shoulder. The right shoulder is the first higher low that indicates a slow change of power from the sellers to the buyers.
Check out this real world example for Jumia Technologies AG (JMIA).

Bearish Reversal Head and Shoulders
This formation is visible at the end of an uptrend. The price moves up and forms the left shoulder, retraces down and continues the pattern to hit the neckline before going back up and forming the head. This price movement confirms the standard trend structure since they form higher highs than the left shoulder. Then the price retraces down and stops again at the neckline to finish the head. Finally, the price resumes its uptrend and forms the right shoulder. It is the first lower high point, and indicates that buyers are starting to lose power and are no longer interested in maintaining their position in the stock.
Check out this real world example for Goldman Sachs Group, Inc. (GS).

There is a lot of variation in the Head and Shoulders formations, and you can get better as spotting them by researching and studying more real-world examples. The main point to remember is to enter when the price breaks the Neckline in the direction of the trend.