7-02 Cup with Handle
The Cup with a Handle pattern is one of the best-known stock chart patterns. The Cup pattern follows the outline of an inverted semi-circle (U-shape), indicating a price fall, a bottoming out, and a price rise. Afterwards, there tends to be a rather unstable period marked by a sell-off generated by investors who acquired the stock near its former position. This often causes a slight tick downward, forming the handle of the cup.
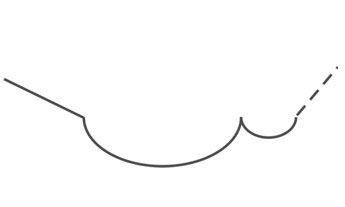
A saucer pattern forms when a security has bottomed out for a while and then starts to move upward. The flattened U-shape resembles a saucer:
- The cup always precedes the handle. As the cup develops, the price pattern follows a gradual bowl shape. There should be an obvious bottom to the bowl. A v-shaped turn is not a good indicator.
- The depth of the cup indicates the potential for a handle and subsequent breakout to develop. The cup should be fairly shallow.
- The handle tends to be down sloping, and indicates a period of consolidation.
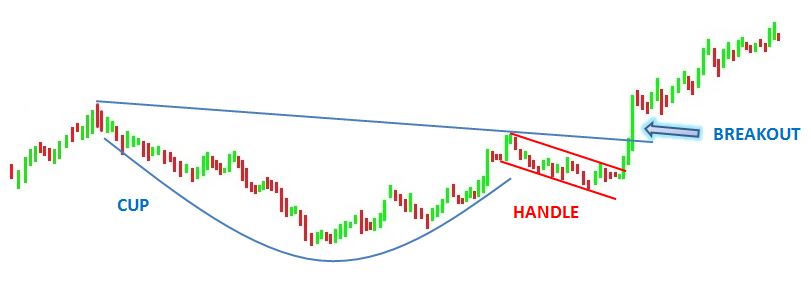
Consolidation occurs when the price seems to bounce between an upper and lower price limit. You can track the down sloping angle of the handle by drawing trendlines across the upper and lower price limits. If the price ascends outside of the trendlines, then it has the potential for breakout. If the price ascends beyond the upper, (right side of the cup) then the pattern is confirmed, particularly if it is accompanied with a sharp increase in volume.
When to Buy
Understandably, we investors like to buy at the lowest possible price. Ideally, we would buy at the bottom of the cup formation. However, by the time the handle formation begins to develop, investors must gauge their level of risk. There is no surefire way to predict when the lowest point will occur, and there is a possibility that the pattern will fail, and breakout in a downtrend.
Some technical analysts believe that the best time to buy is after the handle begins to ascend. According to Rick Martinelli and Barry Hyman, “buy stocks only as they break out of the cup-with-handle to new highs”. Khun suggests a more aggressive method of buying stocks. He suggests that “experienced traders can buy in increments in anticipation of a breakout, but it’s tricky.”
The handle will often slope downwards initially, however, watch for the price to breakout beyond the price at the right side of the cup. The depth of the cup from the right side is an indicator for the potential price increase. Many cups fail after rising only 10% to 15%. Be sure to use stop-loss orders to limit losses or to maximize gains.
Cup with Handle in Action
GameStop (GME) in 2021

The Cup with Handle pattern is a bullish reverse market sentiment, (also known as investor sentiment). This means that investors are generally anticipating a price development, and when the price movement is going upward that is considered “bullish”. In the Cup with Handle pattern, we see the beginning of an uptrend after a period of consolidation.
Here is a description of each major point of this pattern in the chart of GME from March to July of 2021.
- The uptrend from the stock begins to slow down and starts to flatten. It retraces down and forms the left half of the Cup.
- The price will stall and stops moving below a certain price, then it begins to move up slowly and makes the right half of the Cup. Creating higher highs and higher lows than the other side.
- You can see the change of direction in the GME stock. When the price returns to the previous high, the price will stop and retrace back down and form the Handle.
- The Handle indicates only a brief correction period, and buyers return swiftly to push the price up beyond where the Cup started.
The Cup with Handle is a pattern that shows a continuation of a more “bullish” market sentiment after a pause in the upward trend. The entry will be at the brake of the prior high of the left side of the Cup.