6-06 Revenue and Earnings Estimates
When you’re considering buying or selling a stock, it is just as important to look at future expectations as historical performance. We can read all of the 10-Ks and 10-Qs we want; we can study the Income Statements, Cash Flow Statements, and Balance Sheets until we have them all memorized; but that is only half of the battle. A company’s value, and therefore its stock price, is a combination of its current value and its forecasted future earnings.
This is where Revenue and Earnings Estimates come into play – we need some insight on future earnings.
Earnings Estimates
Earlier in the chapter, we talked about EPS, or Earnings per Share. As an investor, finding stocks that have growing EPS is one of the most important ways to ensure long-term growth. However, true EPS is only updated quarterly, when companies publish their audited financial statements. Between updates, investors are trading with each other based on whether they think the EPS will grow or shrink, which can involve a lot of guesswork.
This is where Wall Street analysts come into play. Wall Street has dozens of big investment firms that hire an army of analysts whose only goal in life is to try to figure out what the revenue and earnings of stocks will be BEFORE the financial statements are published.
The end result is an Earnings Estimate – what Wall Street analysts THINK the EPS will be when the company publishes its next quarterly or annual financial statements.

Individual Estimates
The Wall Street analysts are looking for all kinds of things when coming up with their earnings estimate – word on the street, if the cost of some commodity inputs went up, general market trends, and dozens (if not hundreds) of other factors. A single “Analyst” is really a team of financial experts all working together, with the boss acting as the final editor, and gets his name on the final product. As an investor (or potential investor) in this company, it can be very enlightening to read through some Earnings Estimates reports to identify why this analyst is giving the estimate they are, and it usually comes with a recommendation to “buy”, “hold”, or “sell”.
However, it is very important to remember that this analyst is NOT working for this company, is not sitting in on the board room meetings, and does not REALLY know what is going on behind closed doors. This analyst might be using different criteria than other analysts as well, and have their own personal biases, and so a single analyst’s Earnings Estimate may end up being pretty far off the mark.
Individual estimates get published at different times, and every time a new one is published, the stock’s price will move (although usually not by much), depending on the analyst’s assessment.
Consensus Estimates
Very popular companies will have a handful to a dozen different analysts coming up with Earnings Estimates every quarter and trying to keep up with all of them can be a very daunting task. To help with this, most investment news agencies combine the different estimates into a “Consensus Estimate”, which is basically the average of all of the major ones combined.
The consensus estimate does not have the “nitty gritty” of WHY the analysts think this will be the final number, but it benefits by smoothing out the personal biases and differences in calculations between the different analysts.
As a savvy investor, you will spend most of your time looking at the Consensus Estimates, and checking out one or two of the individual estimates if suddenly everyone is expecting a big change in the EPS, but you are not sure why.
Surprises
This is an example of what you might find in a financial research tool talking about Earnings Estimates:
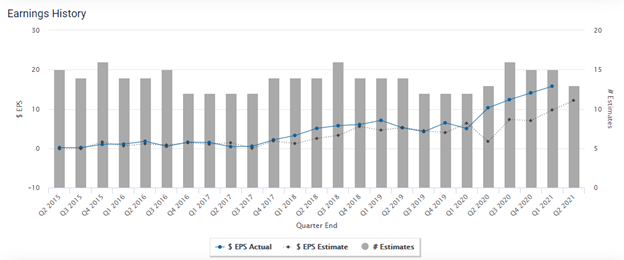
The line charts are measuring the actual EPS every quarter, against what the Consensus Estimate was. The grey bars are counting how many analysts published an estimate. This example is from Amazon (ticker: AMZN). On most of the points of this chart, the estimate and actual EPS were fairly close together.
As an investor, what this means is that when AMZN publishes their quarterly financial statements, you would not expect a huge change in the stock’s price – investors who were listening to the Earnings Estimates did not get any new information from the full financial statements (and it was “priced in” already).
However, there are a few cases where the consensus Earnings Estimate was pretty far off from the Actual EPS from the audited financial statements. This is called a “Surprise”, meaning the consensus estimate was wrong by a large amount. A “Surprise” will cause a big boost in the stock’s volume and a price change, because investors received a bunch of new information that the analysts did not know about all at the same time.
In the chart above, Q2 2020 was a big surprise – the consensus estimate thought EPS would drop a lot compared to Q1, but the actual EPS ended up much higher.
Here is a price chart for that stock around when that was announced – the Q2 financial statements were released on July 31. The stock’s price is the line chart above (with the size of the bars showing the high and low points of the stock that day), while the blue bar charts at the bottom show the day’s trading volume:
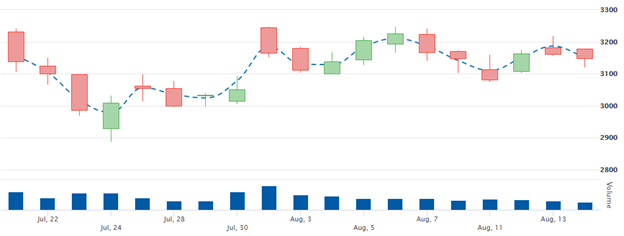
You can see that for the few days leaning into the earnings call, the price was dropping because all the Earnings Estimates said to expect bad news. But on the day of the call, the price shot way up – and this day had the most trading volume too.
What do I do with this information?
Earnings Estimates are a great way to stay informed about what is going on with your stock, but they are not as valuable as the actual EPS released as part of the financial statements. A careful investor will watch the analyst estimates (particularly the consensus estimates) to get a good idea of what is going on with the company they are investing in, but always take an analyst’s estimate with a grain of salt.