4-02 Measuring Risk: The Sharpe Ratio
The Sharpe Ratio, named after Nobel laureate William F. Sharpe, measures the rate of return in association with the level of risk used to obtain that rate. It’s a particularly useful tool for novice investors to use as a method tracking “luck” versus “smarts.”
An Example of the Sharpe Ratio
Look at the performance of these two stocks:
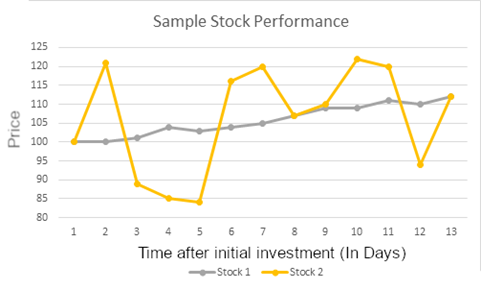
On the first day we track and the last day, these two investments have the same value. However, Stock 1 is very consistent in its returns, while Stock 2 has a very wide range of variance. In this example, if an investor holds both these stocks for 13 days, their return would be the same for both.
However, imagine if the investor sold both stocks on Day 11. The return for Stock 2 would be much higher! But if they waited just one more day, on day 12 Stock 2’s value crashed down, so Stock 1 looks like a better choice.
How To Use The Sharpe Ratio While Investing
When saving and investing, the goal should always be consistent returns and capital preservation; you do not want to make risky moves that could wipe out all the savings you put in. A wise investor would prefer Stock A, since they do not need to worry about “timing the market”, instead they can focus on building a strong long-term portfolio, instead of focusing on when to buy and sell some “hot stocks” at the best prices.
In this example, Stock A would have a much higher Sharpe Ratio than Stock B, because it has much less variance for the same return at the end of the period we looked at.
You can expand this concept to an entire portfolio; if your portfolio value swings up and down a lot, but you end with a higher value, you will have a much lower Sharpe Ratio than someone else who may have a lower final return, but their portfolio value grew at a more consistent rate throughout the trading period.
BOTH measures are very important on determining which portfolio did the “best”. A key to investing is balancing risk and reward; a Sharpe Ratio between 1 and 2 is “good”, between 2 and 3 is “Great”, and greater than 3 is “Excellent”. However, if you are comparing two portfolios with a similar Sharpe Ratio, the standard Return will tell you more about which was a wiser investment.

Calculating The Sharpe Ratio
The Sharpe Ratio requires three numbers:
- The overall percentage return of the stock or portfolio you are analyzing
- A “Risk-Free” rate (usually what you would get if you invested in treasury bonds)
- The standard deviation of the daily returns of that stock or portfolio
The actual calculation looks like this:
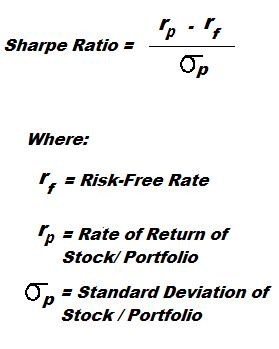
At the top, we are subtracting the “risk free” rate from the actual returns. Because we only care about how risky the investment is, we only want to know how much better it did than “Risk-Free”.
At the bottom, we are dividing this all by the standard deviation of the returns, which measures how much my daily return moved up and down. Because this number is in the bottom of the ratio, high variation = low Sharpe Ratio. You can calculate the Standard Deviation with Excel, Google Sheets, or most other spreadsheet software by using the “STDEV” function.
Limitations of Sharpe Ratio
The limitation of the Sharpe Ratio is that it just tells you that one investment was better than the other comparing risk but does not tell you HOW MUCH better that investment was. In other words, there are no units to measure the added benefit from choosing one investment over another.
For example, imagine you purchased $1000 of stock ABC, and its price shot up 1% in one day – so now you have $1010. You immediately sell the stock and buy a $1000 risk-free treasury bond, with 1% yield.
After a year, you will have earned $10 from the stock on that first day, and another $10 from your bond – a $20, 2% total return. There are not many investors who would be impressed with this. But because you were investing in risk-free bonds for almost the entire year, the variance (and standard deviation) of your portfolio would be almost zero – giving you an extremely high Sharpe Ratio, possibly greater than 10!
Another investor chose very stable index funds, with a 10% annual return. But because the price did go up and down slightly every day, there was some variance, and so their Sharpe Ratio might only be around 3 – usually considered excellent. Comparing the Sharpe Ratio alone, your Sharpe Ratio of 10 looks great, but in reality the other investor probably made the wiser investment decision.