Volatility is a critical concept to understand when trading options. The volatility in the market place can give us a lot of information regarding how we should be trading options. So many people trade options without evaluating the true market value of the options they are trading. This is a peculiar phenomenon because these people would not approach buying a home or a car without looking at the fair market price of these assets. Too often, greed and haste prevent traders from making a more careful assessment. Unfortunately for many option traders, the expected move of the underlying may already be priced into the option’s value. Indeed, many traders sorely discover that when the underlying makes the anticipated move, the option’s price might decline rather than increase. To understand how this works, we must understand volatility.
Volatility is a measure of the rate and magnitude of the change of prices (up or down) of the underlying. If volatility is high, the premium on the option will be relatively high, and vice versa. There are two types of volatility, historical and implied. Historical volatility (also known as statistical volatility) is the actual measure of the volatility of the underlying for its entire existence. Historical volatility is constantly compared with implied volatility to determine if options prices are over- or undervalued.
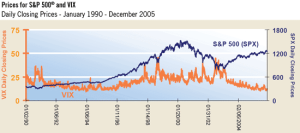
Now what is implied volatility? IV is the estimated volatility of an option’s price. In general, implied volatility increases when the market is bearish and decreases when the market is bullish. The more volatile an option is, the faster the underlying stock price moves up or down. Why? A volatile stock has a better chance of hitting the strike price than a stock that moves 5 cents a day. But, keep in mind that this attribute is already built-into the price of option. You only benefit if the stock becomes more volatile than expected during the options period (term). What if we just want to know if options as a whole are generally more expensive or less expensive than usual? There is a perfect tool for this and it is called the VIX index. The VIX measures how expensive the options on the S&P 500 stock index are. When investors are fearful, and markets are bearish, VIX will rise. When fear recedes, VIX declines. However, long-term low levels of the VIX have been associated with bull markets, where VIX at extreme lows signaled a major market advance, as seen in Figure 19. In 1994 and 2004, VIX remained below 20 and the market developed significant bullish trends.
[link name=”validlink” dest=”/account/validatecode?code=4000016″]If this was part of an assignment, Click Here to confirm you’ve read it[/link]