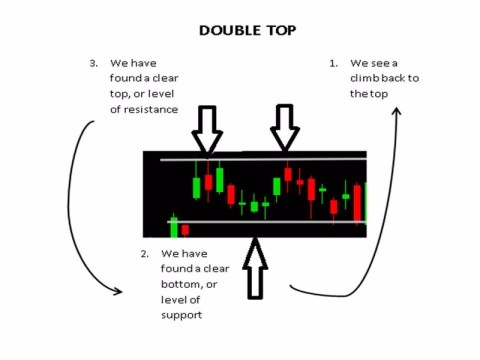
We are now onto the last step of learning how to trade. This step is the most exciting one as we actually get to use charts and make trades off of them. Our style of trading revolves around identifying patterns within charts. We have two main patterns that we use, they are called double tops and double bottoms. We can call a chart pattern a double top when we have a clear top (within a certain level), followed by a clear bottom, followed by a climb back up to that top. Let’s take a look at a chart to see what it looks like. And remember, we are trading with a butcher knife, not a scalpel. If we measure our levels of support and resistance down to the penny, we will never end up making a trade!
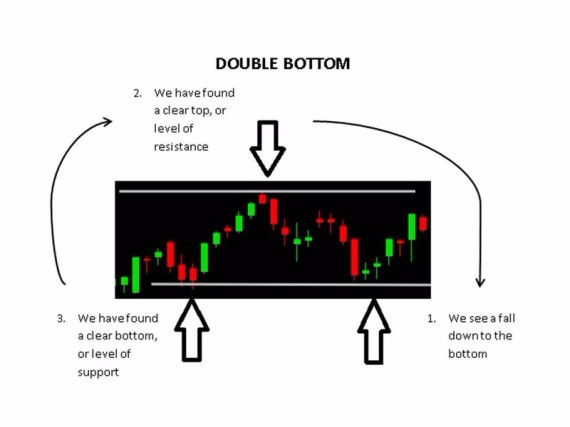
In general, we are trying to identify strong levels of support and resistance within a chart. Regardless of where price and time are at, all charts are the same. We can identify levels of support and resistance on any chart. Let’s take a look at how to identify a double bottom, the opposite of a double top.
[link name=”validlink” dest=”/account/validatecode?code=4000014″]If this was part of an assignment, Click Here to confirm you’ve read it[/link]