Maya runs a small snack-box subscription aimed at urban renters aged 18 to 24. Her segment profile looks solid on paper: young adults, limited kitchen space, late-night study habits. She has not asked a single potential customer whether they would pay $22 a month for curated snacks. Until she does, her target market is still a guess.
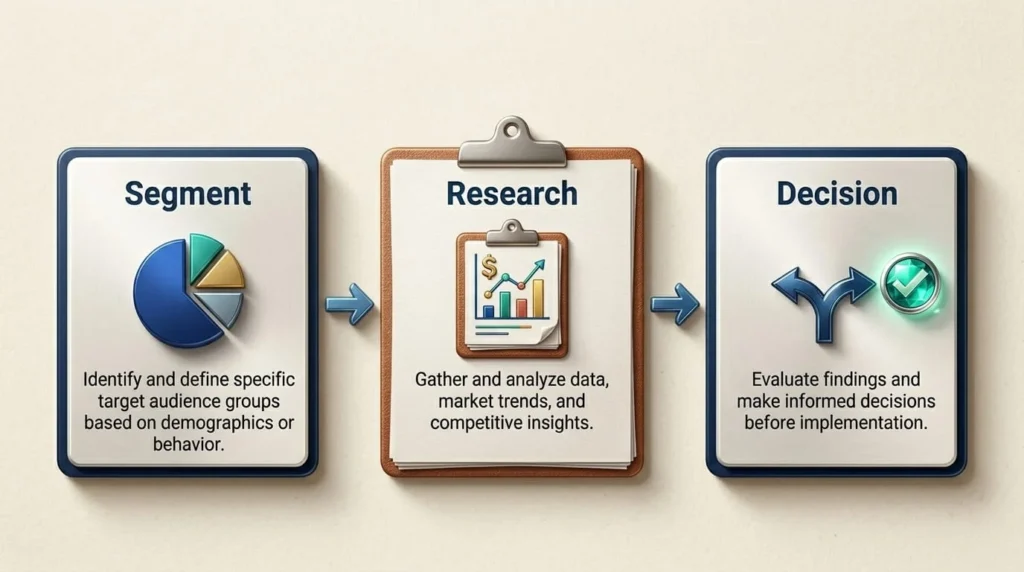
Market research is the process of collecting detailed information about markets, products, and customer behavior to guide marketing decisions. It follows segmentation and targeting. You already chose who you might serve; research tests whether that choice holds up.

Why Research Comes After Segmentation
A target segment is a hypothesis until evidence supports it. Segmentation narrows the field. Research checks whether those customers actually want what you plan to sell, how they shop, and what would change their minds.
Without that step, businessess launch campaigns and products built on assumptions. Many startups fail because they solve problems customers do not care about. Research does not guarantee success. It reduces the chance you spend heavily on the wrong audience or the wrong offer.
Customer Data Foundations
To research a market, you need to know what to collect. Marketers gather two broad categories of customer information.
Demographics
Demographic characteristics are measurable qualities that describe a population: age, sex, race, ethnicity, income, and location. They answer a basic question: who is the customer?
Psychographics
Psychographic characteristics are cognitive and behavioral factors: interests, activities, values, and lifestyles. They help explain why someone might buy.
Businesses collect this data through digital tools (subscriber lists, online accounts, click-tracking software, tracking apps, social media monitoring) and traditional tools (surveys and interviews). Businesses also buy customer data from other businesses. A segment profile describes a group; a customer profile is a fictional sample buyer within that group. If you need a refresher on how segments and targets are chosen, see How Businesses Find Their Ideal Customers.
Quantitative and Qualitative Data
Quantitative
Quantitative data is numerical. It can be measured and analyzed statistically. It answers how many, how much, and how often. A survey might show that 62% of respondents in your target age range would try a subscription snack box at the right price.
Qualitative
Qualitative data is descriptive. It arrives in words and images. It answers why and how. Follow-up interviews might reveal that students care less about gourmet ingredients than about portion size and delivery timing during exam weeks.
Suppose you are testing Maya’s snack-box idea. A short online survey gives you scale: how many renters in her city fit the profile and what price range they mention. Six one-on-one interviews add depth: what frustrates them about grocery runs, whether they trust food subscriptions, and what would make them cancel. Numbers show the size of the opportunity. Stories show what the product must get right.
New Products and Existing Products
Businesses developing new products use market research to evaluate three questions before committing major resources.
Desirability
Do customers want the product? Problem-solution fit.
Desirability asks whether customers want the product. A product is desirable when it achieves problem-solution fit: it creates value by solving a real customer problem. If nobody cares about the problem, a clever solution still struggles.
Feasibility
Can the company build and deliver it?
Feasibility asks whether the company can build and deliver the product. For Maya, that means honest questions about suppliers, storage, packing time, and reliable delivery to apartment buildings—not just whether the idea sounds good in a pitch.
Viability
Does the business make money doing it?
Viability asks whether the business can make money doing it. Research on market size, price tiers, and competitor offers helps here: even strong demand does not help if every box loses money after shipping. Secondary data often gives enough insight on whether an idea can sustain a price customers will pay.
Research for Products Already on the Market
Businesses with existing products use research to track changing customer needs, spot innovation opportunities, and plan how to retain or grow market share. Markets shift. Competitors copy features. What worked last year may feel stale today. Ongoing research keeps messaging, pricing, and product updates aligned with real demand.
Secondary-Source Research
Secondary-source research gathers information that already exists. Government publications, commercial databases, academic studies, and industry reports often include market size (in dollars and in total customers), market trends, market segments, and factors that influence customer decisions.
Primary-source research, covered in the next sections, collects firsthand data from your own audience. Companies use both. Secondary research is usually the cheaper starting point. It maps competitors, industry trends, and the wider landscape, including PESTEL factors (political, economic, social, technological, environmental, and legal forces) that shape opportunities.
For a full PESTEL framework, see 5 Ways to Assess Business Risk.
Businesses interpret secondary findings, including public data on rival companies, to judge whether a product idea fits the market before running large primary studies. A secondary scan might show that snack subscriptions grew in Maya’s city but that three established brands already dominate her price tier. That does not kill her idea. It tells her what primary questions still need answers.
Hypotheses and Primary-Source Research
A business hypothesis states an assumption about a customer, product, or market. Companies test those assumptions before committing to a campaign, a price change, or a full product launch.
Maya might hypothesize: “Urban renters aged 18 to 24 in our city will pay at least $18 per month for a weekly snack box delivered to their building.” That sentence is specific enough to test. You can survey price sensitivity, run a small pilot, or A/B test two price points on a landing page.
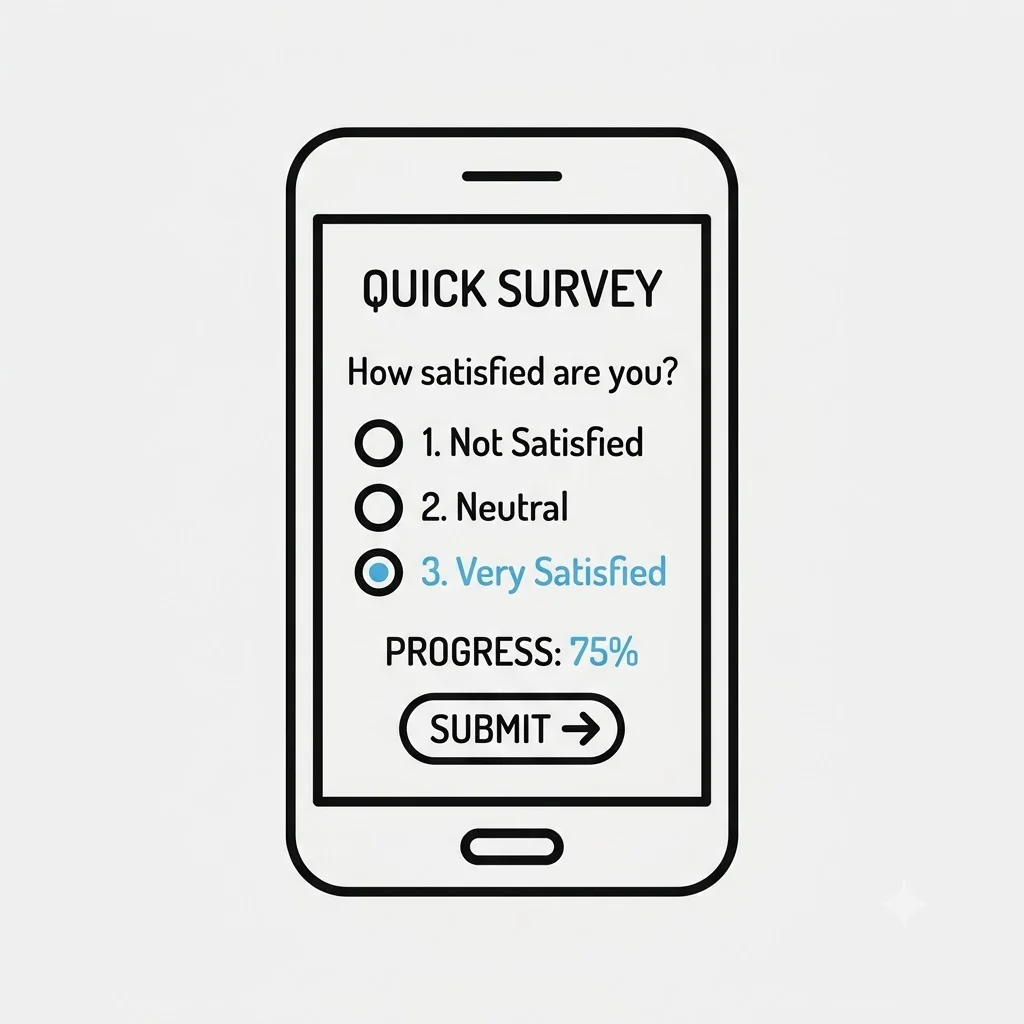
Primary-source research collects original data to test the hypothesis. Common methods include surveys, A/B testing, focus groups, interviews, experiments, and observations. The method you pick depends on the type of data you need.
When to Use each Primary Method
| If you need… | Consider |
|---|---|
| Large-scale quantitative views from a population | Surveys |
| In-depth qualitative explanations with follow-up questions | Focus groups or one-on-one interviews |
| Evidence of what customers do, not just what they say | Experiments or in-person observations |
| A real-world comparison of two viable options | A/B testing |
Surveys work when you need a lot of data to test patterns across a wide-range of potential customers: demand sizing, pricing bands, or feature preferences.
Focus groups and one-on-one interviews suit smaller samples where depth matters. A moderator can ask why someone hesitated, probe confusing wording, or explore emotions that a checkbox survey would miss.
Experiments and observations capture behavior. In an experiment, you control conditions (two checkout layouts, two ad versions). In observation, you watch customers in a natural setting (how they move through a store, how long they read a product page).
A/B testing is a type of experiment. Users are randomly shown version A or version B of a page, price, or message. Whichever version drives more conversions, sign-ups, or sales provides evidence about preference in a live environment. The method you pick depends on what you need to learn — as these three examples show.
Café Pastry Display
A café chain wants to know whether customers would order more pastries if display cases sat near the register instead of at the back wall.
Best fit: Observation in several locations, possibly followed by an experiment that moves the case in one store and compares sales.
Skincare Survey
A skincare brand needs nationwide data on how many teens would pay $12 for a monthly acne kit.
Best fit: Survey with a sample large enough to represent the target population.
Game Studio Trailers
A game studio has two trailer concepts and wants to know which storyline makes test players feel more excited to preorder.
Best fit: Focus group or interviews for qualitative reactions, then A/B testing of both trailers with a broader audience to measure click-through and preorder rates.
Most strong research programs mix methods. Qualitative work often surfaces the right questions; quantitative work tests whether those patterns hold at scale.
Quality, Limits, and Big Data
Even careful research can mislead you if the design is weak.
Sample size and population fit matter. Asking fifty people who do not match your target segment cannot validate a hypothesis about urban renters. Questions must use neutral phrasing. A leading question like “How much did you enjoy our excellent customer service?” pushes respondents toward a positive answer and will skew your results.
Digital marketing tools now collect big data: large volumes of information on how customers respond to ads, emails, and websites, and which signals correlate with purchase likelihood. Click streams, purchase histories, and A/B test results can update quickly.
Traditional channels vary in feedback. Personal selling allows back-and-forth conversation, so a salesperson hears objections in real time, but only one customer at a time. TV ads and billboards reach huge audiences with almost no direct response data unless you add a separate tracking mechanism.
Despite strong tools, businesses cannot always predict customer and market responses. You will often decide with limited, unclear, or contradictory data. Good teams launch pilots, watch results, and revise rather than waiting for perfect certainty.
Communicating Research: Choosing and Reading Charts
Data visualizations turn research findings into patterns stakeholders can grasp quickly. The chart type should match the question you are answering.
| Research Question | Chart Type | What it Shows |
|---|---|---|
| Compare categories or year | Bar chart | Side-by-side values |
| Compare totals and subcategories | Stacked bar chart | Parts within each bar |
| Track change over time | Line graph | Trend across periods |
| Show share of a whole | Pie chart | Percentage of total |
Bar Charts
Use a bar chart when you want to compare values across categories or time periods. The chart below shows fictional annual revenue for four snack-box competitors.
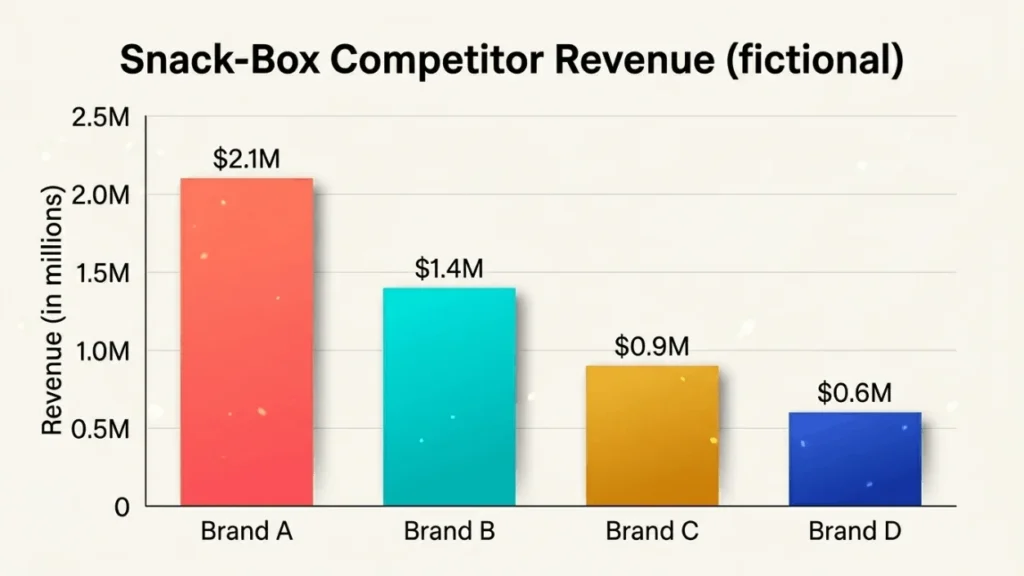
Revenue is not the same as profit or customer loyalty. What is this chart unable to tell you about whether a new snack-box brand could compete? If you were Maya, would you read Brand D’s small bar as a warning to stay out — or as a sign that smaller players can survive?
Stacked Bar Charts
Use a stacked bar chart when you need to compare totals and see how parts contribute to each whole. The chart below shows fictional snack-box sales in one city across two years, split by product line.
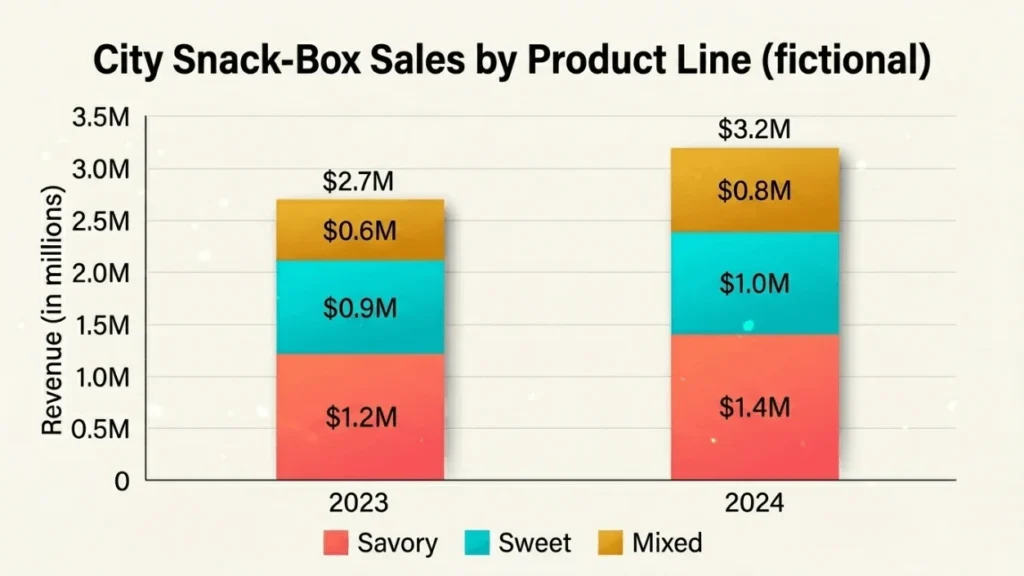
Total growth can hide a weak product line inside the stack. If savory sales drove most of the increase, what might happen to your 2025 inventory plan if you treated every line as equally healthy? What cost or margin data would you need before copying last year’s mix?
Line Graphs
Use a line graph to track change over time. The chart below shows fictional active subscribers for Maya’s pilot from January through June.
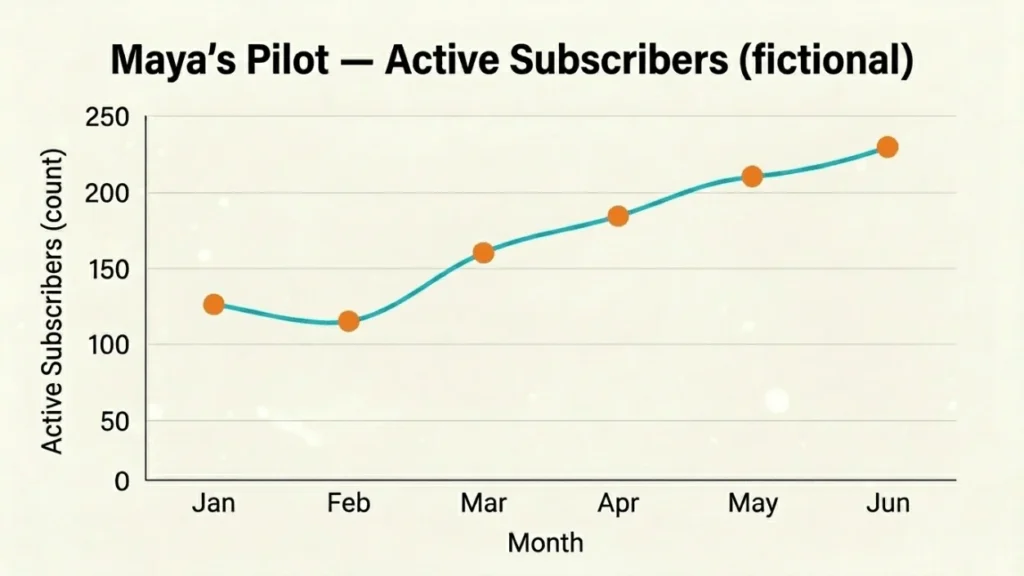
A rising subscriber count does not prove the business works. What could be going wrong behind this line if many new sign-ups cancel after the first month? When would this chart alone be enough to justify scaling ads — and when would you insist on revenue or retention data first?
Pie Charts
Use a pie chart to show how a whole divides into parts — such as market share. The chart below shows fictional snack-box market share in one region.
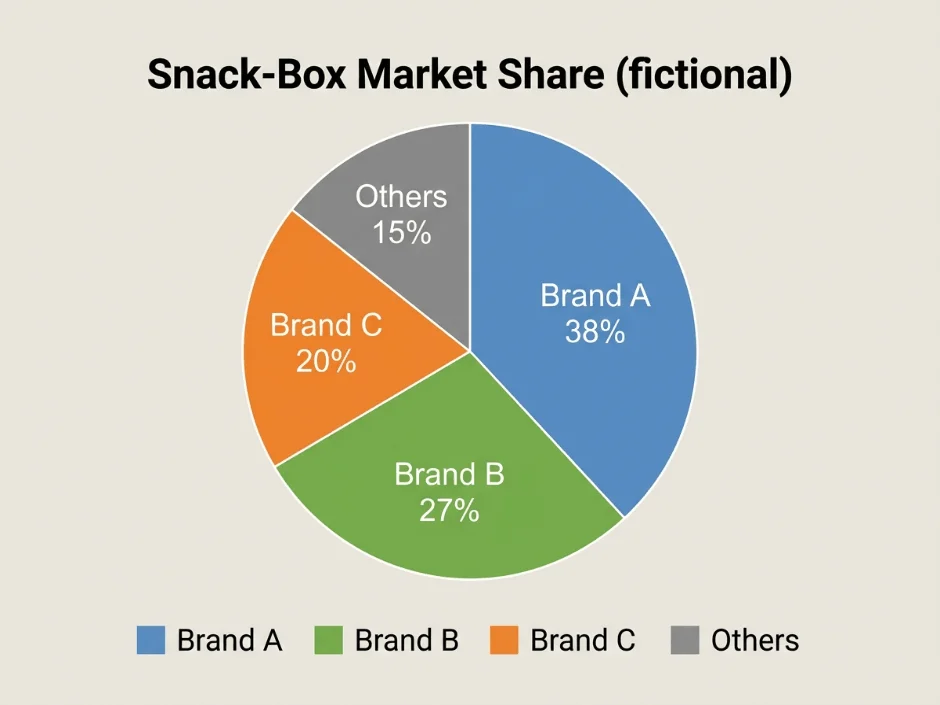
Market share shows where sales went, not where they are heading. If the three leaders already control most of the pie, should Maya chase their customers directly or target the “Others” slice? What would you want to know about customer satisfaction, pricing, or switching costs before copying the market leader’s strategy?
Choose the visualization that makes the insight obvious. A trend belongs in a line graph, not a pie chart. A part-to-whole split belongs in a pie or stacked bar, not a single line.
From Research to Action
You have data. The harder part is knowing what to do with it. Before you launch a marketing campaign or scale a product, run through these seven steps in order. Each one sets up the next.
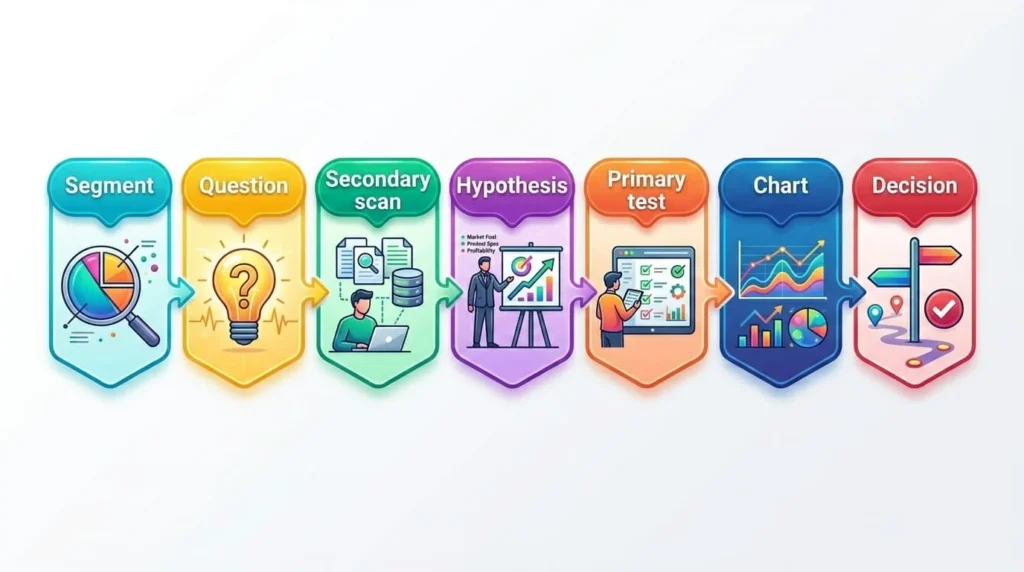
- Segment your audience . Who are you trying to reach, and what problem does your offer solve?
- Ask one clear question. Turn the business problem into a sentence you can test.
- Scan secondary research. Read published data on market size, trends, rivals, and PESTEL factors.
- Write your hypothesis. State what you assume to be true. If you cannot test it, it’s still a guess.
- Run your primary test. Choose a survey, interview, focus group, experiment, observation, or A/B test — or combine methods.
- Chart your data. Pick a chart that tells the story in the clearest way possible.
- Decide and adjust as you gather more information over time.
Even good research leaves gaps. Customers change their minds. Competitors enter and exit the market. A pilot that works in one neighborhood may flop in another. Although having good market research decreases your risk of failure, it doesn’t remove it. You’ll still need to test and iterate as you develop stronger relationships with your customers who will be your best source of feedback for how to improve.