How To Save Money on Your Next Trip
Imagine you’re planning a dream vacation. Perhaps a senior trip after graduation. You might spend days researching flights, hotels, and car rentals to find the best deals. Now, think about how much time you spend planning your financial future—probably not as much, right? Yet, both require strategic thinking, budgeting, and analysis. In this lesson, we’ll show how understanding data can help you make smart decisions in both areas.

Vacation Planning – 5 cities
You are planning on taking a vacation – but need to keep your costs down. You are exploring 5 options, and look up how much it would cost for a flight and hotel for a 4 day, 3 night trip.
| City | Flight | Hotel |
|---|---|---|
| Chicago | $350 | $350 |
| New York | $275 | $450 |
| Montreal | $400 | $250 |
| Vancouver | $375 | $400 |
| Miami | $450 | $500 |
You would be happy with any of these options – so you want to make your pick based on total price.
Explanatory vs Response Variables
The research you did so far has given you two explanatory variables (also called independent variables). What you really want to find, however, is a response variable (also called a dependent variable). A response variable is the result of the explanatory variables, or you can also think of it as the explanatory variables explaining the result of the response variable.
In this case, the response variable would be total expected trip cost. So far, you think all you need to be worried about is the flight and hotel, so you can simply add the flight and hotel together to get total cost as the output.
| City | Flight | Hotel | Total Cost |
|---|---|---|---|
| Chicago | $ 350 | $ 350 | $ 700 |
| New York | $ 275 | $ 450 | $ 725 |
| Montreal | $ 400 | $ 250 | $ 650 |
| Vancouver | $ 375 | $ 400 | $ 775 |
| Miami | $ 450 | $ 500 | $ 950 |
Armed with this information, it looks like Montreal is going to be the cheapest option – so is it time to start booking flights and packing bags?

Lurking Variables
Before you book your trip, you check in with your jet-set aunt to make sure you did not forget anything before you choose where you’re going. She takes one quick look and says you are missing your food budget, and this can make a big impact on the trip.
Sure – you think food is important too! For 4 days, you probably will spend about $75 a day on food (so $300 over the 4 days), so you can add this into the total budget.
| City | Flight | Hotel | Food | Total Cost |
|---|---|---|---|---|
| Chicago | $ 350 | $ 350 | $ 300 | $ 1,000 |
| New York | $ 275 | $ 450 | $ 300 | $ 1,025 |
| Montreal | $ 400 | $ 250 | $ 300 | $ 950 |
| Vancouver | $ 375 | $ 400 | $ 300 | $ 1,075 |
| Miami | $ 450 | $ 500 | $ 300 | $ 1,250 |
Adding $300 to each line makes the total cost more expensive, but it does not change the decision – Montreal is still the cheapest. You check in again with your aunt, who points out a big problem with your food budget: Montreal and Vancouver are in Canada, and food is a lot more expensive in Canada than the United States. Even when controlling for the exchange rate between countries, food prices can be 30% higher in Canada (at the time of this writing).
This means that “In Canada” is a lurking variable in your model – “food” might be an explanatory variable when calculating total cost, but whether or not the city you are travelling to is in Canada is an explanatory variable in calculating the expected cost of food! Once you include “Food Cost Difference” in your model, “In Canada” is no longer lurking – you dragged it out into the light.
| City | Flight | Hotel | Food Multiplier | Food Total | Total Cost |
|---|---|---|---|---|---|
| Chicago | $ 350 | $ 350 | 100% | $ 300 | $ 1,000 |
| New York | $ 275 | $ 450 | 100% | $ 300 | $ 1,025 |
| Montreal | $ 400 | $ 250 | 130% | $ 390 | $ 1,040 |
| Vancouver | $ 375 | $ 400 | 130% | $ 390 | $ 1,165 |
| Miami | $ 450 | $ 500 | 100% | $ 300 | $ 1,250 |
With this in mind, Montreal is no longer quite so cheap – it looks like you will be flying to Chicago!

Deep Dive into Food Cost
After working with your aunt to pick where you want to visit, you are still getting nervous about food costs and really nail down your food budget.
To help estimate your food budget for your trip to Chicago, you explore your favorite food delivery app. You search for local restaurants that offer dishes you might enjoy ordering during your stay. After an hour of browsing, you’ve compiled a list of 20 enticing options, a significantly larger number than you’ll likely order during your actual trip.

| Food | Price |
|---|---|
| Pierogi | $ 9 |
| Breaded Steak Sandwich | $ 13 |
| Italian Sub | $ 9 |
| Rainbow Cone Icecream | $ 5 |
| Donuts | $ 7 |
| Chicken Vesuvio | $ 17 |
| Italian Beef Sandwich | $ 10 |
| Fried Chicken | $ 16 |
| Reuben Sandwich | $ 8 |
| Specialty Tacos | $ 14 |
| Chicago Hot Dog | $ 6 |
| Fettuccini Alfredo | $ 22 |
| Steak Dinner | $ 50 |
| Extra Large Deep Dish Pizza | $ 53 |
| Burrito | $ 9 |
| Chicago-Style Popcorn | $ 17 |
| Smoked Shrimp | $ 9 |
| Gourmet Cheeseburger | $ 22 |
| Mapo Tofu | $ 20 |
| Tavern-Style Pizza | $ 33 |
You won’t be able to try all of these restaurants during your trip, and you’re likely to discover other delicious options once you arrive in Chicago. However, this list provides a valuable starting point for estimating your food expenses during your visit.
Using Frequency Distribution to Visualize Data
To determine the overall cost of the meals you’re interested in, you can create a chart that categorizes the number of options available at different price points.
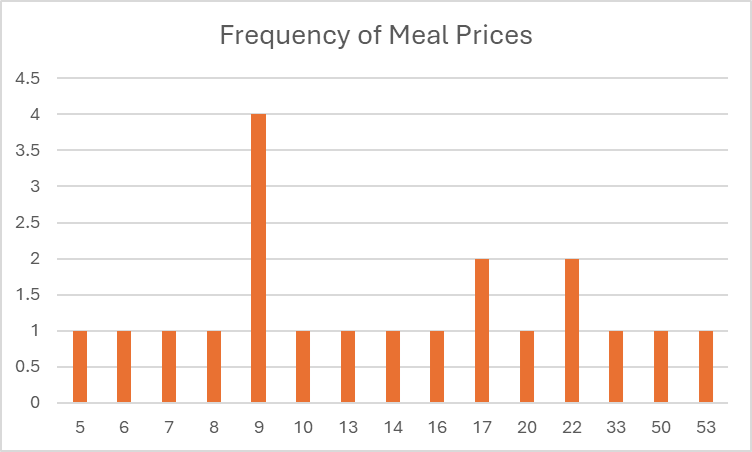
You scratch your head – not sure what you learned here. The most common price is $9, but most prices only happen once.
In order to get a more useful chart, you will instead need to use a histogram. A histogram groups data points into intervals or ‘bins’ of equal size. This visually represents the frequency of data points within each interval, providing a clearer picture of the overall data distribution.
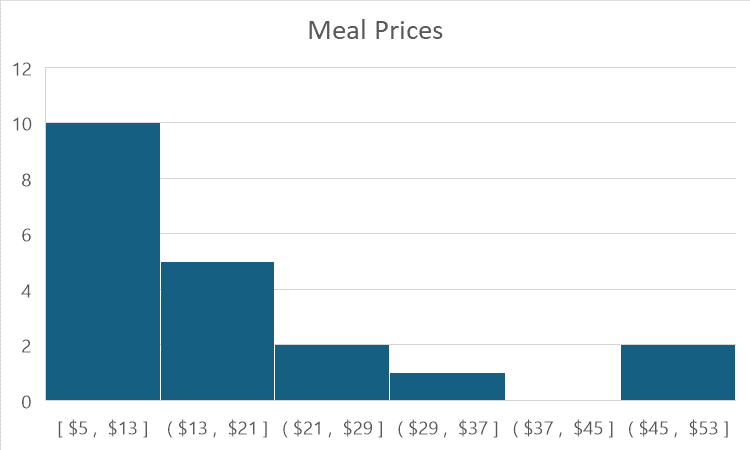
This histogram groups all of your meal options in increments of $8 – so every bin size covers an $8 range. You can see you had lots of options in the cheap range, nothing on your wish list at all between $37 and $45, then a couple very expensive items on the high end of your wish list.
What this helps you see is that most of the items you’re going to want to buy will be pretty inexpensive – and now we can plan for how much to actually budget!
Measures of Central Tendency
You are planning to spend $8 on coffee and a pastry every morning for breakfast, so now you need to know how much you will spend for lunch and dinner. There are three ways you can plan out this cost: the Mean, Median, and Mode.
The Mean
The mean is the average of all prices. To calculate the mean, we can add up all the items on your wish list, and divide it by the total count. In Sigma Notation, this can be expressed as:

The Sigma sign (Σ) means add up each item in a set, from the number on the bottom to the number on the top. As for what exactly to add up, it means B (the value) of each item (“i” means each item). The “n” represents the total items in the set – so what this means is:
- For each item in the list (i), get its value
- And add all the values together
- Because i = 1 at the bottom, and is summing up to n on the top, this means from the first to the last item on the list
- Then multiply by 1 / the total number of items
Adding all items together and dividing by 20, we find that the average cost of the items in your wish list is $17.45. This means you could budget $8 for breakfast, plus $17.45 each for both lunch and dinner, so you would need to plan on $42.90 per day, or $171.60 for the entire 4-day trip. Not bad!
The Median
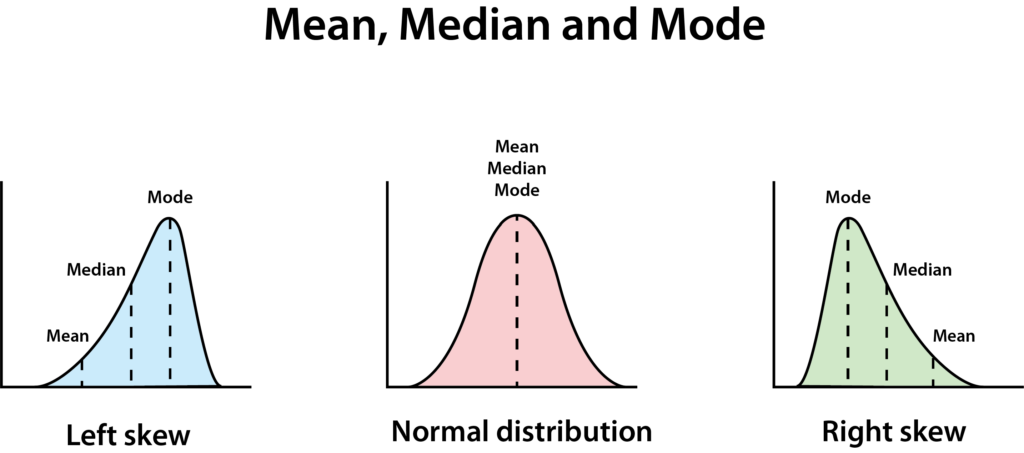
Another way to calculate the representative cost of your meals is to find the median, or “middle number”. We already saw in the histogram that there are some very expensive options at the high end, that might be skewing your average day. To find the median, put all your prices in order, and find the middle number in the list.
| Food | Price |
|---|---|
| Rainbow Cone Ice Cream | $ 5 |
| Chicago Hot Dog | $ 6 |
| Donuts | $ 7 |
| Reuben Sandwich | $ 8 |
| Pierogi | $ 9 |
| Italian Sub | $ 9 |
| Burrito | $ 9 |
| Smoked Shirmp | $ 9 |
| Italian Beef Sandwich | $ 10 |
| Breaded Steak Sandwich | $ 13 |
| Specialty Tacos | $ 14 |
| Fried Chicken | $ 16 |
| Chicken Vesuvio | $ 17 |
| Chicago-Style Popcorn | $ 17 |
| Mapo Tofu | $ 20 |
| Fettuccini Alfredo | $ 22 |
| Groumet Cheeseburger | $ 22 |
| Tavern-Style Pizza | $ 33 |
| Steak Dinner | $ 50 |
| Extra Large Deep Dish Pizza | $ 53 |

In this case there are two middle numbers – 13 and 14. If you are comparing a list with even numbers (where there are two in the middle), the median is simply the average of the two numbers in the middle. The average of 13 and 14 is 13.5, so that is our median – even cheaper the average!
The Mode
You can also try to see how much cash you are going to spend in most of your meals – this is the mode. There are two ways to look at the mode – a true mode, or a statistical mode.
The true mode is simply the value that appears most frequently in the dataset. In our initial list, the mode was 9, as this price occurred most often.
However, since we won’t be ordering the exact items on the original list, a more accurate representation of the mode can be derived from the histogram. By identifying the bin with the highest frequency (the tallest bar), we can determine the most common price range for the meals you’re likely to get.
Here, we can see the bin from $5 to $13 is the biggest bin – so we know right away that most of our meals are probably going to be pretty cheap. That helps us feel good that we likely are not going to go over budget – and a few extra snacks will be just fine!
Mean Deviation
There is one more exercise that we can do with these numbers to help us understand how our spending is likely to play out – the mean deviation.
The mean deviation is how much each of the items in a list differs from the average of the list. In other words, it helps us understand if using the mean is a good measurement at all – if the mean deviation is very large, it means the average is not very good at telling us what to expect because there is so much variation in the sample.
To calculate the mean deviation, you first need to take the absolute value of each item in the sample, minus the sample average. In Sigma Notation, this would be expressed as:
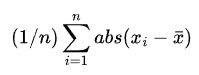
This looks similar to the sigma notation of average – in fact, the x with a bar over it actually means the average of this series of data. But in this case, we are adding together the absolute value of each item in this series minus the average of the series. Then, we’re dividing by the number of items in the series.
| Food | Price | Absolute Difference from Average Price |
|---|---|---|
| Pierogi | $ 9.00 | $ 8.45 |
| Breaded Steak Sandwich | $ 13.00 | $ 4.45 |
| Italian Sub | $ 9.00 | $ 8.45 |
| Rainbow Cone Ice Cream | $ 5.00 | $ 12.45 |
| Donuts | $ 7.00 | $ 10.45 |
| Chicken Vesuvio | $ 17.00 | $ 0.45 |
| Italian Beef Sandwich | $ 10.00 | $ 7.45 |
| Fried Chicken | $ 16.00 | $ 1.45 |
| Reuben Sandwich | $ 8.00 | $ 9.45 |
| Specialty Tacos | $ 14.00 | $ 3.45 |
| Chicago Hot Dog | $ 6.00 | $ 11.45 |
| Fettuccini Alfredo | $ 22.00 | $ 4.55 |
| Steak Dinner | $ 50.00 | $ 32.55 |
| Extra Large Deep Dish Pizza | $ 53.00 | $ 35.55 |
| Burrito | $ 9.00 | $ 8.45 |
| Chicago-Style Popcorn | $ 17.00 | $ 0.45 |
| Smoked Shrimp | $ 9.00 | $ 8.45 |
| Gourmet Cheeseburger | $ 22.00 | $ 4.55 |
| Mapo Tofu | $ 20.00 | $ 2.55 |
| Tavern-Style Pizza | $ 33.00 | $ 15.55 |
Remember that the average (mean) price of the meals was $17.45. To calculate the deviation of each meal price, we determine the difference between its actual price and the average price.
Next, we calculate the average of these deviations, resulting in a mean deviation of $9.53. This value provides valuable insights for budgeting. For example, if you prefer to pay with cash, the mean deviation helps you estimate a reasonable range of expected meal costs.
Since the average meal price is $17.45 and the mean deviation is $9.53, we can anticipate that most meals will cost between $7.92 and $26.98. This information helps you know how much cash to have on hand.
The concept of mean deviation has broader applications when planning how you will spend your money in other areas of your budget. For instance, it can help you estimate the likely range of expenses for your upcoming grocery trip, even if you don’t have a precise list of items.
Conclusion: Using Data for Smarter Financial Decisions
By understanding how data works—whether it’s vacation costs or your daily spending—you can make more informed financial choices. Measures of central tendency and concepts like explanatory and response variables can help you analyze any situation, from budgeting a trip to planning your financial future. It is fun to plan real or imaginary vacations and trips but planning for a better financial future can be rewarding as well.